| 1 | # Visualization date and time controls |
| 2 | |
| 3 | Netdata's dashboard features powerful date visualization controls that include a time control, a timezone selector and a rich date and timeframe selector. |
| 4 | |
| 5 | The controls come with useful defaults and rich customization to help you narrow your focus when troubleshooting issues or anomalies. |
| 6 | |
| 7 | ## Time controls |
| 8 | |
| 9 | The time control provides you the following options: **Play**, **Pause** and **Force Play**. |
| 10 | |
| 11 | - **Play** - the content of the page will be automatically refreshed while this is in the foreground |
| 12 | - **Pause** - the content of the page isn't refreshed due to a manual request to pause it or, for example, when your investigating data on a chart (cursor is on top of a chart) |
| 13 | - **Force Play** - the content of the page will be automatically refreshed even if this is in the background |
| 14 | |
| 15 | With this, we aim to bring more clarity and allow you to distinguish if the content you’re looking at is live or historical and also allow you to always refresh the content of the page when the tabs are in the background. |
| 16 | |
| 17 | Main use cases for **Force Play**: |
| 18 | |
| 19 | - You use a terminal or deployment tools to do changes in your infra and want to see the effect immediately; Netdata is in the background, displaying the impact of these changes |
| 20 | - You want to have Netdata in the background, example displayed on a TV, to constantly see metrics through dashboards or to watch the alert status |
| 21 | |
| 22 | 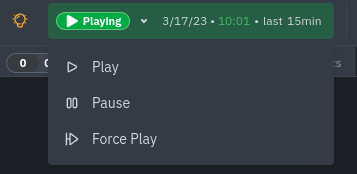 |
| 23 | |
| 24 | ## Date and time selector |
| 25 | |
| 26 | The date and time selector allows you to change the visible timeframe and change the timezone used in the interface. |
| 27 | |
| 28 | ### Pick timeframes to visualize |
| 29 | |
| 30 | While [panning through time and zooming in/out](/docs/dashboards-and-charts/netdata-charts.md) from charts, it is helpful when you're looking a recent history, or want to do granular troubleshooting, what if you want to see metrics from 6 hours ago? Or 6 days? |
| 31 | |
| 32 | Netdata's dashboard features a **timeframe selector** to help you visualize specific timeframes in a few helpful ways. |
| 33 | By default, it shows a certain number of minutes of historical metrics based on your browser's viewport to ensure it's always showing per-second granularity. |
| 34 | |
| 35 | #### Open the timeframe selector |
| 36 | |
| 37 | To visualize a new timeframe, you need to open the picker, which appears just above the menu, near the top-right bar of the dashboard. |
| 38 | |
| 39 | 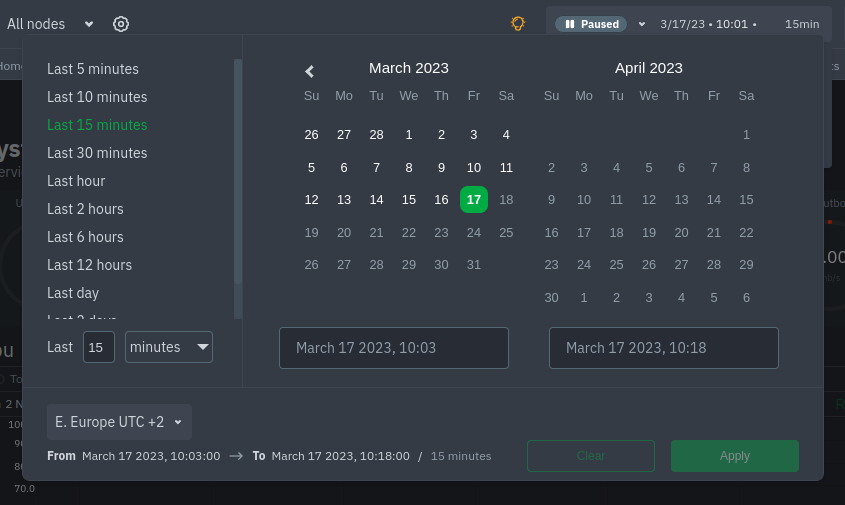 |
| 40 | |
| 41 | The **Clear** button resets the dashboard back to its default state based on your browser viewport, and **Apply** closes |
| 42 | the picker and shifts all charts to the selected timeframe. |
| 43 | |
| 44 | #### Use the pre-defined timeframes |
| 45 | |
| 46 | Click any of the following options in the predefined timeframe column to choose between: |
| 47 | |
| 48 | - Last 5 minutes |
| 49 | - Last 15 minutes |
| 50 | - Last 30 minutes |
| 51 | - Last hour |
| 52 | - Last 2 hours |
| 53 | - Last 6 hours |
| 54 | - Last 12 hours |
| 55 | - Last day |
| 56 | - Last 2 days |
| 57 | - Last 7 days |
| 58 | |
| 59 | Click **Apply** to see metrics from your selected timeframe. |
| 60 | |
| 61 | #### Choose a specific interval |
| 62 | |
| 63 | Beneath the predefined timeframe columns is an input field and dropdown you use in combination to select a specific timeframe of |
| 64 | minutes, hours, days, or months. Enter a number and choose the appropriate unit of time, then click **Apply**. |
| 65 | |
| 66 | #### Choose multiple days via the calendar |
| 67 | |
| 68 | Use the calendar to select multiple days. Click on a date to begin the timeframe selection, then an ending date. The |
| 69 | timeframe begins at noon on the beginning and end dates. Click **Apply** to see your selected multi-day timeframe. |
| 70 | |
| 71 | #### Caveats and considerations |
| 72 | |
| 73 | **Longer timeframes will decrease metrics granularity**. At the default timeframe, based on your browser viewport, each |
| 74 | "tick" on charts represents one second. If you select a timeframe of 6 hours, each tick represents the _average_ value |
| 75 | across a larger period of time. |
| 76 | |
| 77 | **You can only see metrics as far back in history as your metrics retention policy allows**. Netdata uses an internal |
| 78 | time-series database (TSDB) to store as much metrics as it can within a specific amount of disk space. The default |
| 79 | storage is 256 MiB, which should be enough for 1–3 days of historical metrics. If you navigate back to a timeframe |
| 80 | beyond stored historical metrics, you'll see this message: |
| 81 | |
| 82 | 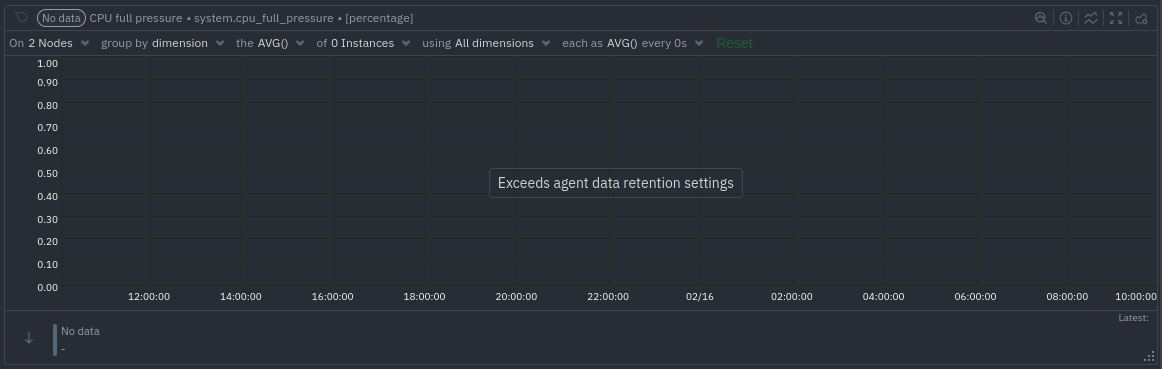 |
| 83 | |
| 84 | At any time, [configure the internal TSDB's storage capacity](/src/database/CONFIGURATION.md) to expand your |
| 85 | depth of historical metrics. |
| 86 | |
| 87 | ### Timezone selector |
| 88 | |
| 89 | The default timezone used in all date and time fields in Netdata Cloud comes from your browser. To change it, open the |
| 90 | date and time selector and use the control displayed here: |
| 91 | |
| 92 | 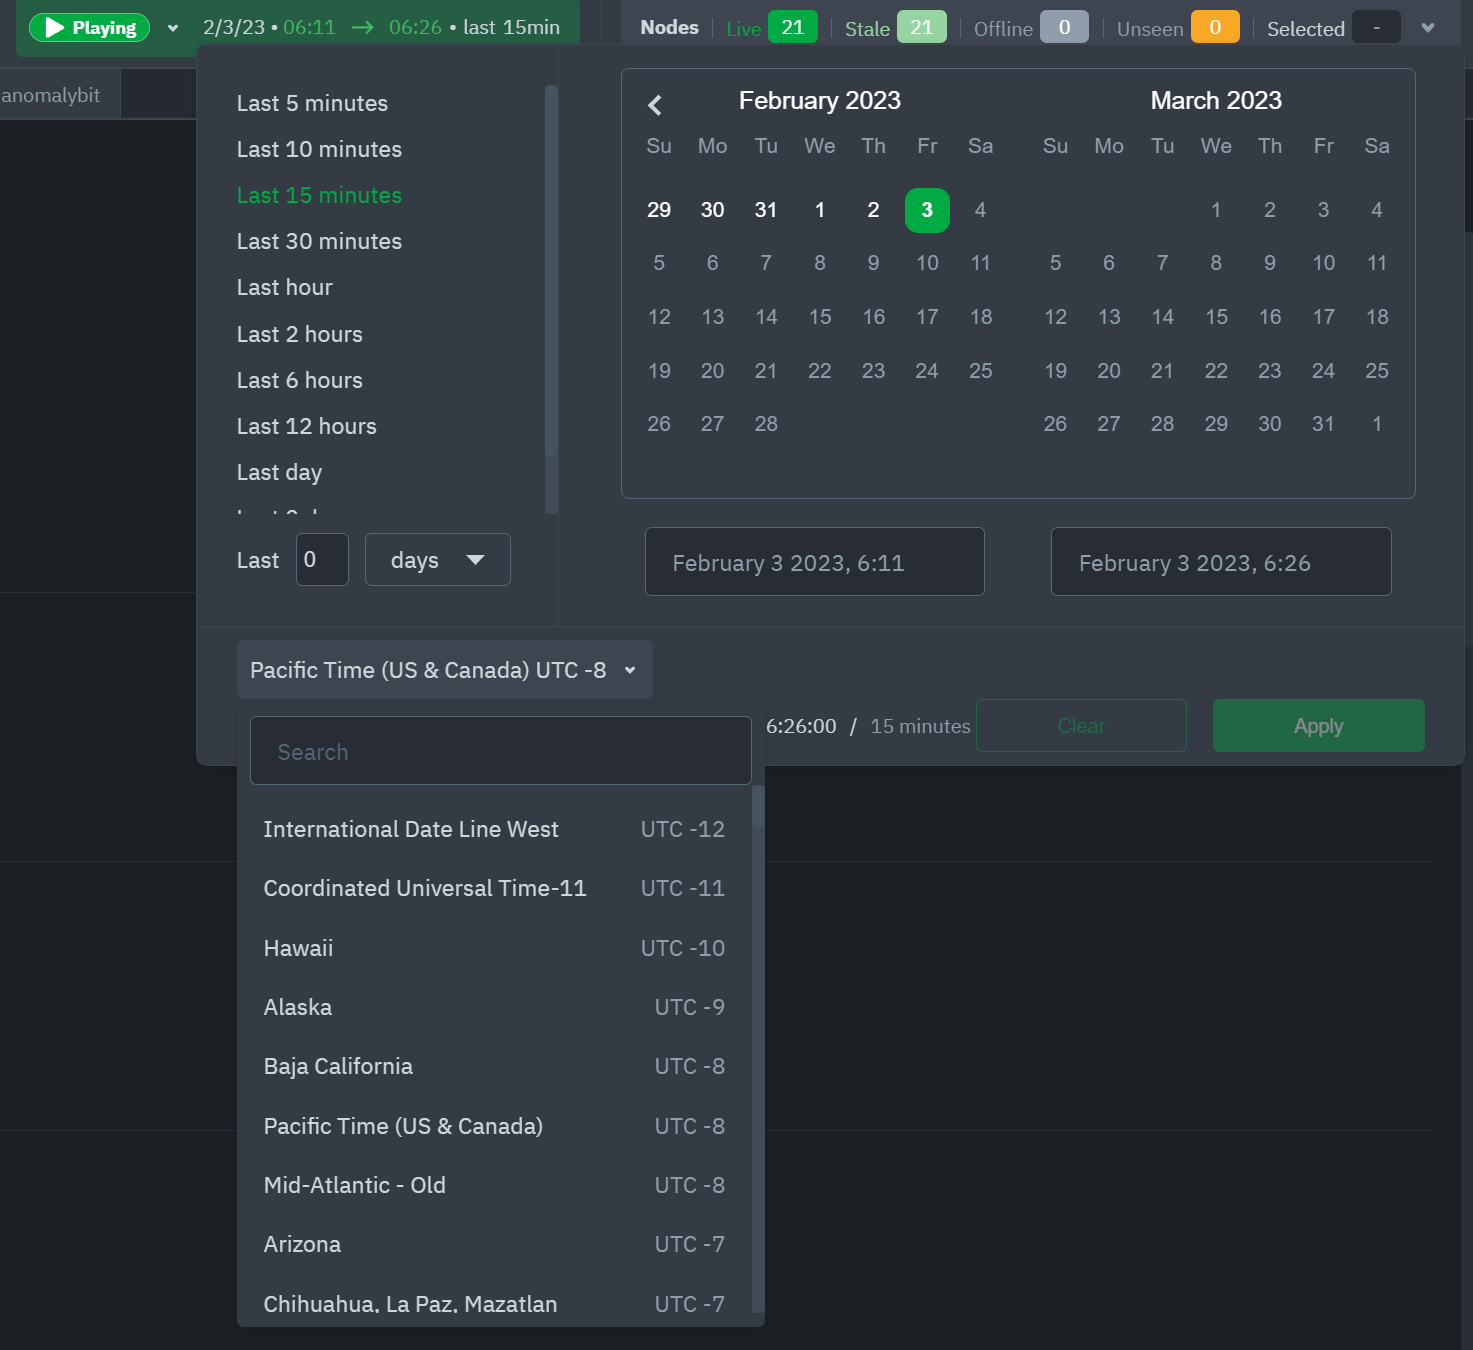 |