| 1 | # Monitor, troubleshoot, and debug applications with eBPF metrics |
| 2 | |
| 3 | When trying to troubleshoot or debug a finicky application, there's no such thing as too much information. At Netdata, |
| 4 | we developed programs that connect to the [_extended Berkeley Packet Filter_ (eBPF) virtual |
| 5 | machine](/src/collectors/ebpf.plugin/README.md) to help you see exactly how specific applications are interacting with the |
| 6 | Linux kernel. With these charts, you can root out bugs, discover optimizations, diagnose memory leaks, and much more. |
| 7 | |
| 8 | This means you can see exactly how often, and in what volume, the application creates processes, opens files, writes to |
| 9 | filesystem using virtual filesystem (VFS) functions, and much more. Even better, the eBPF collector gathers metrics at |
| 10 | an _event frequency_, which is even faster than Netdata's beloved 1-second granularity. When you troubleshoot and debug |
| 11 | applications with eBPF, rest assured you miss not even the smallest meaningful event. |
| 12 | |
| 13 | Using this guide, you'll learn the fundamentals of setting up Netdata to give you kernel-level metrics from your |
| 14 | application so that you can monitor, troubleshoot, and debug to your heart's content. |
| 15 | |
| 16 | ## Configure `apps.plugin` to recognize your custom application |
| 17 | |
| 18 | To start troubleshooting an application with eBPF metrics, you need to ensure your Netdata dashboard collects and |
| 19 | displays those metrics independent of any other process. |
| 20 | |
| 21 | You can use the `apps_groups.conf` file to configure which applications appear in charts generated by |
| 22 | [`apps.plugin`](/src/collectors/apps.plugin/README.md). Once you edit this file and create a new group for the application |
| 23 | you want to monitor, you can see how it's interacting with the Linux kernel via real-time eBPF metrics. |
| 24 | |
| 25 | Let's assume you have an application that runs on the process `custom-app`. To monitor eBPF metrics for that application |
| 26 | separate from any others, you need to create a new group in `apps_groups.conf` and associate that process name with it. |
| 27 | |
| 28 | Open the `apps_groups.conf` file in your Netdata configuration directory. |
| 29 | |
| 30 | ```bash |
| 31 | cd /etc/netdata # Replace this path with your Netdata config directory |
| 32 | sudo ./edit-config apps_groups.conf |
| 33 | ``` |
| 34 | |
| 35 | Scroll down past the explanatory comments and stop when you see `# NETDATA processes accounting`. Above that, paste in |
| 36 | the following text, which creates a new `dev` group with the `custom-app` process. Replace `custom-app` with the name of |
| 37 | your application's process name. |
| 38 | |
| 39 | Your file should now look like this: |
| 40 | |
| 41 | ```text |
| 42 | ... |
| 43 | # ----------------------------------------------------------------------------- |
| 44 | # Custom applications to monitor with apps.plugin and ebpf.plugin |
| 45 | |
| 46 | dev: custom-app |
| 47 | |
| 48 | # ----------------------------------------------------------------------------- |
| 49 | # NETDATA processes accounting |
| 50 | ... |
| 51 | ``` |
| 52 | |
| 53 | Restart Netdata with `sudo systemctl restart netdata`, or the [appropriate method](/docs/netdata-agent/start-stop-restart.md) for your system, to begin seeing metrics for this particular |
| 54 | group+process. You can also add additional processes to the same group. |
| 55 | |
| 56 | You can set up `apps_groups.conf` to more show more precise eBPF metrics for any application or service running on your |
| 57 | system, even if it's a standard package like Redis, Apache, or any other [application/service Netdata collects |
| 58 | from](/src/collectors/COLLECTORS.md). |
| 59 | |
| 60 | ```text |
| 61 | # ----------------------------------------------------------------------------- |
| 62 | # Custom applications to monitor with apps.plugin and ebpf.plugin |
| 63 | |
| 64 | dev: custom-app |
| 65 | database: *redis* |
| 66 | apache: *apache* |
| 67 | |
| 68 | # ----------------------------------------------------------------------------- |
| 69 | # NETDATA processes accounting |
| 70 | ... |
| 71 | ``` |
| 72 | |
| 73 | Now that you have `apps_groups.conf` set up to monitor your application/service, you can also set up the eBPF collector |
| 74 | to show other charts that will help you debug and troubleshoot how it interacts with the Linux kernel. |
| 75 | |
| 76 | ## Configure the eBPF collector to monitor errors |
| 77 | |
| 78 | The eBPF collector has [two possible modes](/src/collectors/ebpf.plugin/README.md#ebpf-load-mode): `entry` and `return`. The default |
| 79 | is `entry`, and only monitors calls to kernel functions, but the `return` also monitors and charts _whether these calls |
| 80 | return in error_. |
| 81 | |
| 82 | Let's turn on the `return` mode for more granularity when debugging Firefox's behavior. |
| 83 | |
| 84 | ```bash |
| 85 | cd /etc/netdata # Replace this path with your Netdata config directory |
| 86 | sudo ./edit-config ebpf.d.conf |
| 87 | ``` |
| 88 | |
| 89 | Replace `entry` with `return`: |
| 90 | |
| 91 | ```text |
| 92 | [global] |
| 93 | ebpf load mode = return |
| 94 | disable apps = no |
| 95 | |
| 96 | [ebpf programs] |
| 97 | process = yes |
| 98 | network viewer = yes |
| 99 | ``` |
| 100 | |
| 101 | Restart Netdata with `sudo systemctl restart netdata`, or the [appropriate method](/docs/netdata-agent/start-stop-restart.md) for your system. |
| 102 | |
| 103 | ## Get familiar with per-application eBPF metrics and charts |
| 104 | |
| 105 | Visit the Netdata dashboard at `http://NODE:19999`, replacing `NODE` with the hostname or IP of the system you're using |
| 106 | to monitor this application. Scroll down to the **Applications** section. These charts now feature a `firefox` dimension |
| 107 | with metrics specific to that process. |
| 108 | |
| 109 | Pay particular attention to the charts in the **ebpf file**, **ebpf syscall**, **ebpf process**, and **ebpf net** |
| 110 | subsections. These charts are populated by low-level Linux kernel metrics thanks to eBPF, and showcase the volume of |
| 111 | calls to open/close files, call functions like `do_fork`, IO activity on the VFS, and much more. |
| 112 | |
| 113 | See the [eBPF collector documentation](/src/collectors/ebpf.plugin/README.md#integration-with-appsplugin) for the full list |
| 114 | of per-application charts. |
| 115 | |
| 116 | Let's show some examples of how you can first identify normal eBPF patterns, then use that knowledge to identify |
| 117 | anomalies in a few simulated scenarios. |
| 118 | |
| 119 | For example, the following screenshot shows the number of open files, failures to open files, and closed files on a |
| 120 | Debian 10 system. The first spike is from configuring/compiling a small C program, then from running Apache's `ab` tool |
| 121 | to benchmark an Apache web server. |
| 122 | |
| 123 | 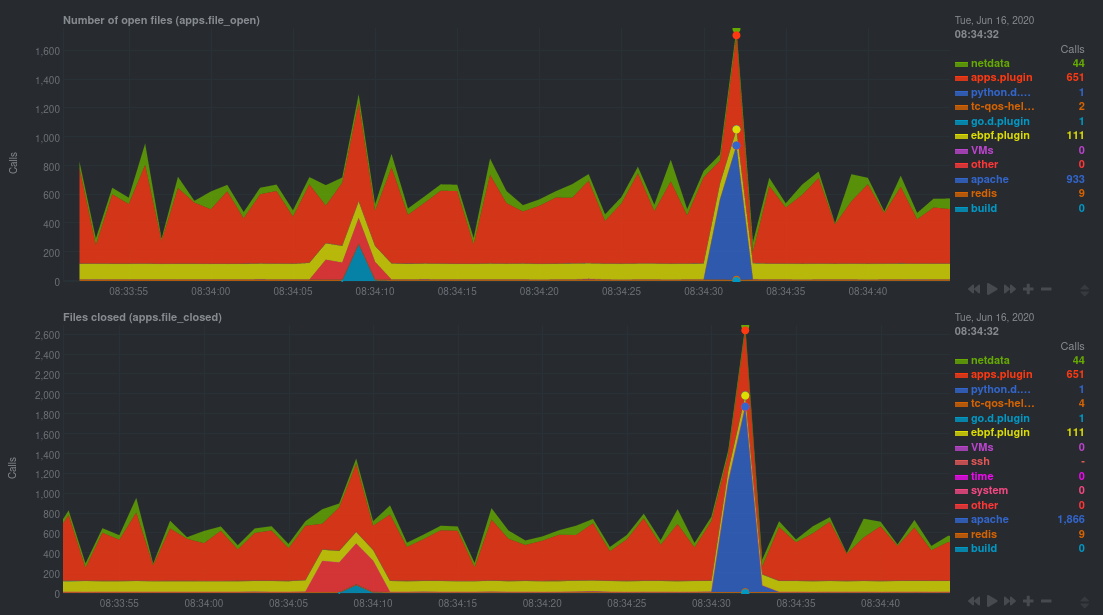 |
| 125 | |
| 126 | In these charts, you can see first a spike in syscalls to open and close files from the configure/build process, |
| 127 | followed by a similar spike from the Apache benchmark. |
| 128 | |
| 129 | > 👋 Remember that you can view chart data directly via Netdata's API! |
| 130 | > |
| 131 | > For example, open your browser and navigate to `http://NODE:19999/api/v1/data?chart=apps.file_open`, replacing `NODE` |
| 132 | > with the IP address or hostname of your Agent. The API returns JSON of that chart's dimensions and metrics, which you |
| 133 | > can use in other operations. |
| 134 | > |
| 135 | > To see other charts, replace `apps.file_open` with the context of the chart you want to see data for. |
| 136 | > |
| 137 | > To see all the API options, visit our [Swagger |
| 138 | > documentation](https://editor.swagger.io/?url=https://raw.githubusercontent.com/netdata/netdata/master/src/web/api/netdata-swagger.yaml) |
| 139 | > and look under the **/data** section. |
| 140 | |
| 141 | ## Troubleshoot and debug applications with eBPF |
| 142 | |
| 143 | The actual method of troubleshooting and debugging any application with Netdata's eBPF metrics depends on the |
| 144 | application, its place within your stack, and the type of issue you're trying to root cause. This guide won't be able to |
| 145 | explain how to troubleshoot _any_ application with eBPF metrics, but it should give you some ideas on how to start with |
| 146 | your own systems. |
| 147 | |
| 148 | The value of using Netdata to collect and visualize eBPF metrics is that you don't have to rely on existing (complex) |
| 149 | command line eBPF programs or, even worse, write your own eBPF program to get the information you need. |
| 150 | |
| 151 | Let's walk through some scenarios where you might find value in eBPF metrics. |
| 152 | |
| 153 | ### Benchmark application performance |
| 154 | |
| 155 | You can use eBPF metrics to profile the performance of your applications, whether they're custom or a standard Linux |
| 156 | service, like a web server or database. |
| 157 | |
| 158 | For example, look at the charts below. The first spike represents running a Redis benchmark _without_ pipelining |
| 159 | (`redis-benchmark -n 1000000 -t set,get -q`). The second spike represents the same benchmark _with_ pipelining |
| 160 | (`redis-benchmark -n 1000000 -t set,get -q -P 16`). |
| 161 | |
| 162 | 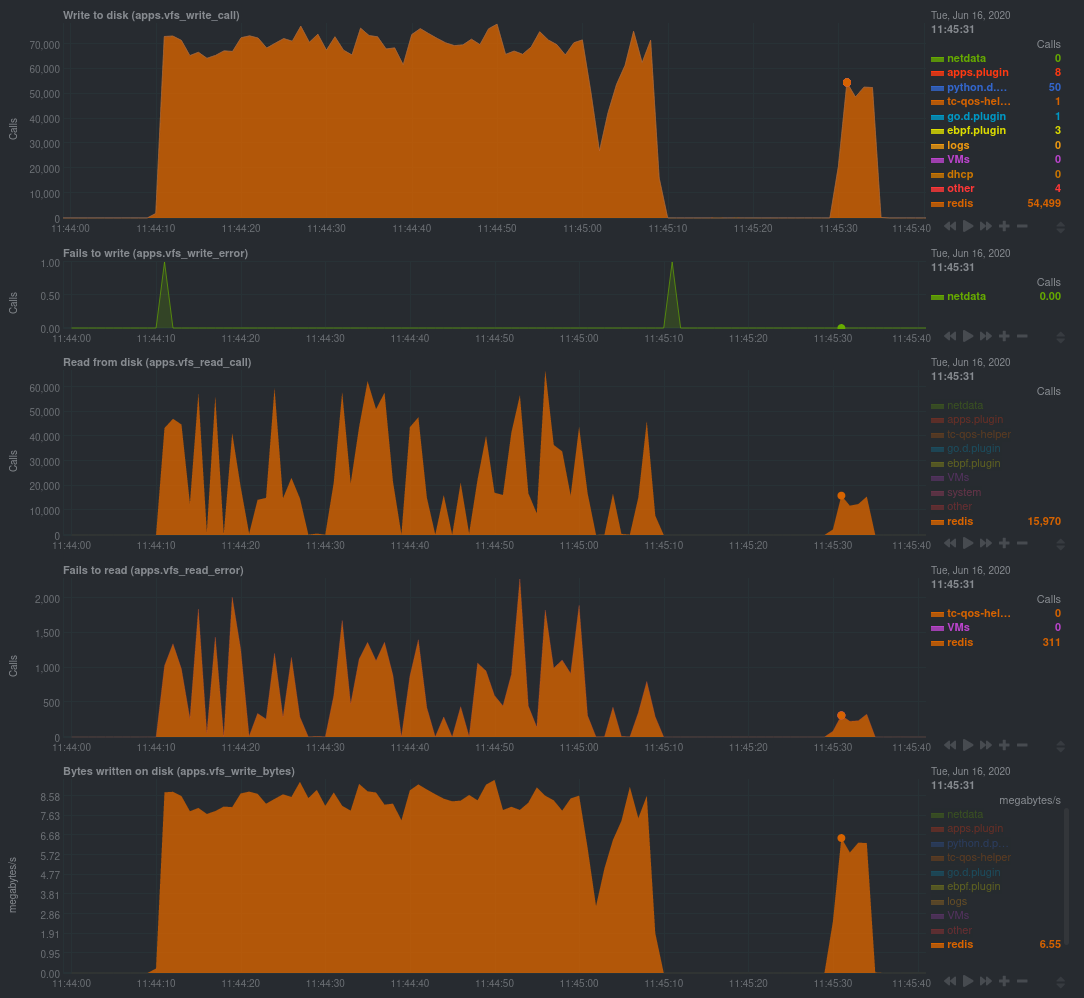 |
| 164 | |
| 165 | The performance optimization is clear from the speed at which the benchmark finished (the horizontal length of the |
| 166 | spike) and the reduced write/read syscalls and bytes written to disk. |
| 167 | |
| 168 | You can run similar performance benchmarks against any application, view the results on a Linux kernel level, and |
| 169 | continuously improve the performance of your infrastructure. |
| 170 | |
| 171 | ### Inspect for leaking file descriptors |
| 172 | |
| 173 | If your application runs fine and then only crashes after a few hours, leaking file descriptors may be to blame. |
| 174 | |
| 175 | Check the **Number of open files (apps.file_open)** and **Files closed (apps.file_closed)** for discrepancies. These |
| 176 | metrics should be more or less equal. If they diverge, with more open files than closed, your application may not be |
| 177 | closing file descriptors properly. |
| 178 | |
| 179 | See, for example, the volume of files opened and closed by `apps.plugin` itself. Because the eBPF collector is |
| 180 | monitoring these syscalls at an event level, you can see at any given second that the open and closed numbers as equal. |
| 181 | |
| 182 | This isn't to say Netdata is _perfect_, but at least `apps.plugin` doesn't have a file descriptor problem. |
| 183 | |
| 184 | 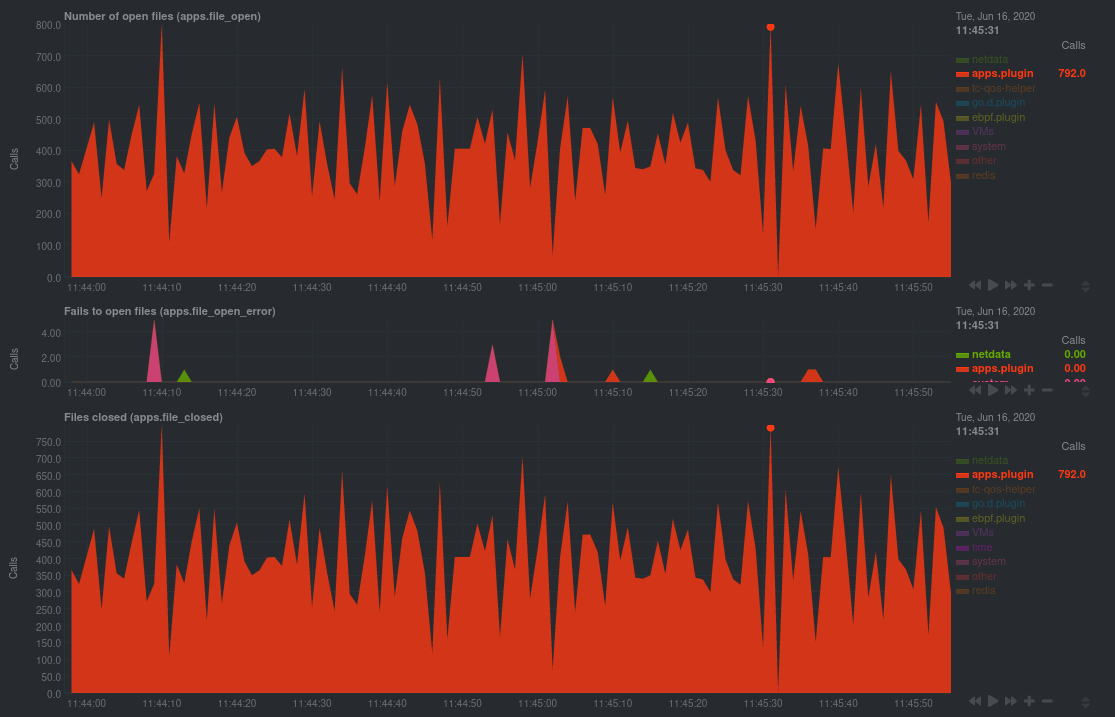 |
| 186 | |
| 187 | ### Pin down syscall failures |
| 188 | |
| 189 | If you enabled the eBPF collector's `return` mode as mentioned [in a previous |
| 190 | step](#configure-the-ebpf-collector-to-monitor-errors), you can view charts related to how often a given application's |
| 191 | syscalls return in failure. |
| 192 | |
| 193 | By understanding when these failures happen, and when, you might be able to diagnose a bug in your application. |
| 194 | |
| 195 | To diagnose potential issues with an application, look at the **Fails to open files (apps.file_open_error)**, **Fails to |
| 196 | close files (apps.file_close_error)**, **Fails to write (apps.vfs_write_error)**, and **Fails to read |
| 197 | (apps.vfs_read_error)** charts for failed syscalls coming from your application. If you see any, look to the surrounding |
| 198 | charts for anomalies at the same time frame, or correlate with other activity in the application or on the system to get |
| 199 | closer to the root cause. |
| 200 | |
| 201 | ### Investigate zombie processes |
| 202 | |
| 203 | Look for the trio of **Process started (apps.process_create)**, **Threads started (apps.thread_create)**, and **Tasks |
| 204 | closed (apps.task_close)** charts to investigate situations where an application inadvertently leaves [zombie |
| 205 | processes](https://en.wikipedia.org/wiki/Zombie_process). |
| 206 | |
| 207 | These processes, which are terminated and don't use up system resources, can still cause issues if your system runs out |
| 208 | of available PIDs to allocate. |
| 209 | |
| 210 | For example, the chart below demonstrates a [zombie factory |
| 211 | program](https://www.refining-linux.org/archives/7-Dr.-Frankenlinux-or-how-to-create-zombie-processes.html) in action. |
| 212 | |
| 213 | 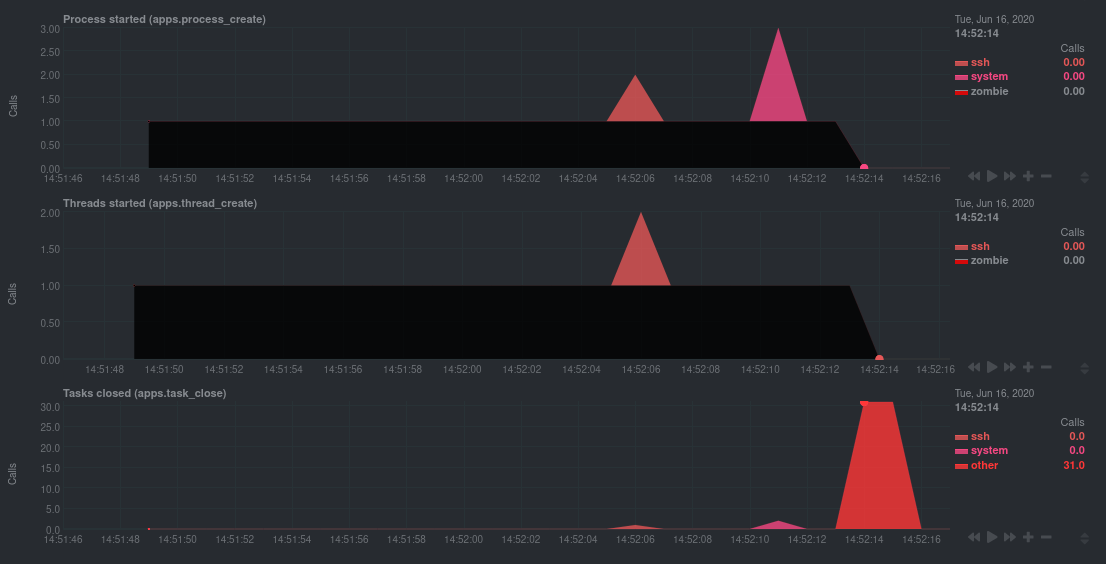 |
| 215 | |
| 216 | Starting at 14:51:49, Netdata sees the `zombie` group creating one new process every second, but no closed tasks. This |
| 217 | continues for roughly 30 seconds, at which point the factory program was killed with `SIGINT`, which results in the 31 |
| 218 | closed tasks in the later second. |
| 219 | |
| 220 | Zombie processes may not be catastrophic, but if you're developing an application on Linux, you should eliminate them. |
| 221 | If a service in your stack creates them, you should consider filing a bug report. |
| 222 | |
| 223 | ## View eBPF metrics in Netdata Cloud |
| 224 | |
| 225 | You can also show per-application eBPF metrics in Netdata Cloud. This could be particularly useful if you're running the |
| 226 | same application on multiple systems and want to correlate how it performs on each target, or if you want to share your |
| 227 | findings with someone else on your team. |
| 228 | |
| 229 | If you don't already have a Netdata Cloud account, go [sign in](https://app.netdata.cloud) and get started for free. |
| 230 | You can also read how to [monitor your infrastructure with Netdata Cloud](/docs/netdata-cloud/organize-your-infrastructure-invite-your-team.md) to understand the key features that it has to offer. |
| 231 | |
| 232 | Once you've added one or more nodes to a Space in Netdata Cloud, you can see aggregated eBPF metrics in the Overview |
| 233 | dashboard under the same **Applications** or **eBPF** sections that you |
| 234 | find on the local Agent dashboard. Or, [create new dashboards](/docs/dashboards-and-charts/dashboards-tab.md) using eBPF metrics |
| 235 | from any number of distributed nodes to see how your application interacts with multiple Linux kernels on multiple Linux |
| 236 | systems. |
| 237 | |
| 238 | Now that you can see eBPF metrics in Netdata Cloud, you can [invite your |
| 239 | team](/docs/netdata-cloud/organize-your-infrastructure-invite-your-team.md#set-up-team-access) and share your findings with others. |