| 1 | # Import, export, and print a snapshot |
| 2 | |
| 3 | > ❗This feature is only available on v1 dashboards, it hasn't been port-forwarded to v2. |
| 4 | > For more information on accessing dashboards, check [this documentation](/docs/dashboards-and-charts/README.md). |
| 5 | |
| 6 | Netdata can export snapshots of the contents of your dashboard at a given time, which you can then import into any other |
| 7 | node running Netdata. Or, you can create a print-ready version of your dashboard to save to PDF or actually print to |
| 8 | paper. |
| 9 | |
| 10 | Snapshots can be incredibly useful for diagnosing anomalies after they've already happened. Let's say Netdata triggered a warning alert while you were asleep. In the morning, you can [select the |
| 11 | timeframe](/docs/dashboards-and-charts/visualization-date-and-time-controls.md) when the alert triggered, export a snapshot, and send it to a |
| 12 | |
| 13 | colleague for further analysis. |
| 14 | |
| 15 | Or, send the Netdata team a snapshot of your dashboard when [filing a bug report](https://github.com/netdata/netdata/issues/new?assignees=&labels=bug%2Cneeds+triage&template=BUG_REPORT.yml) on GitHub. |
| 16 | |
| 17 | 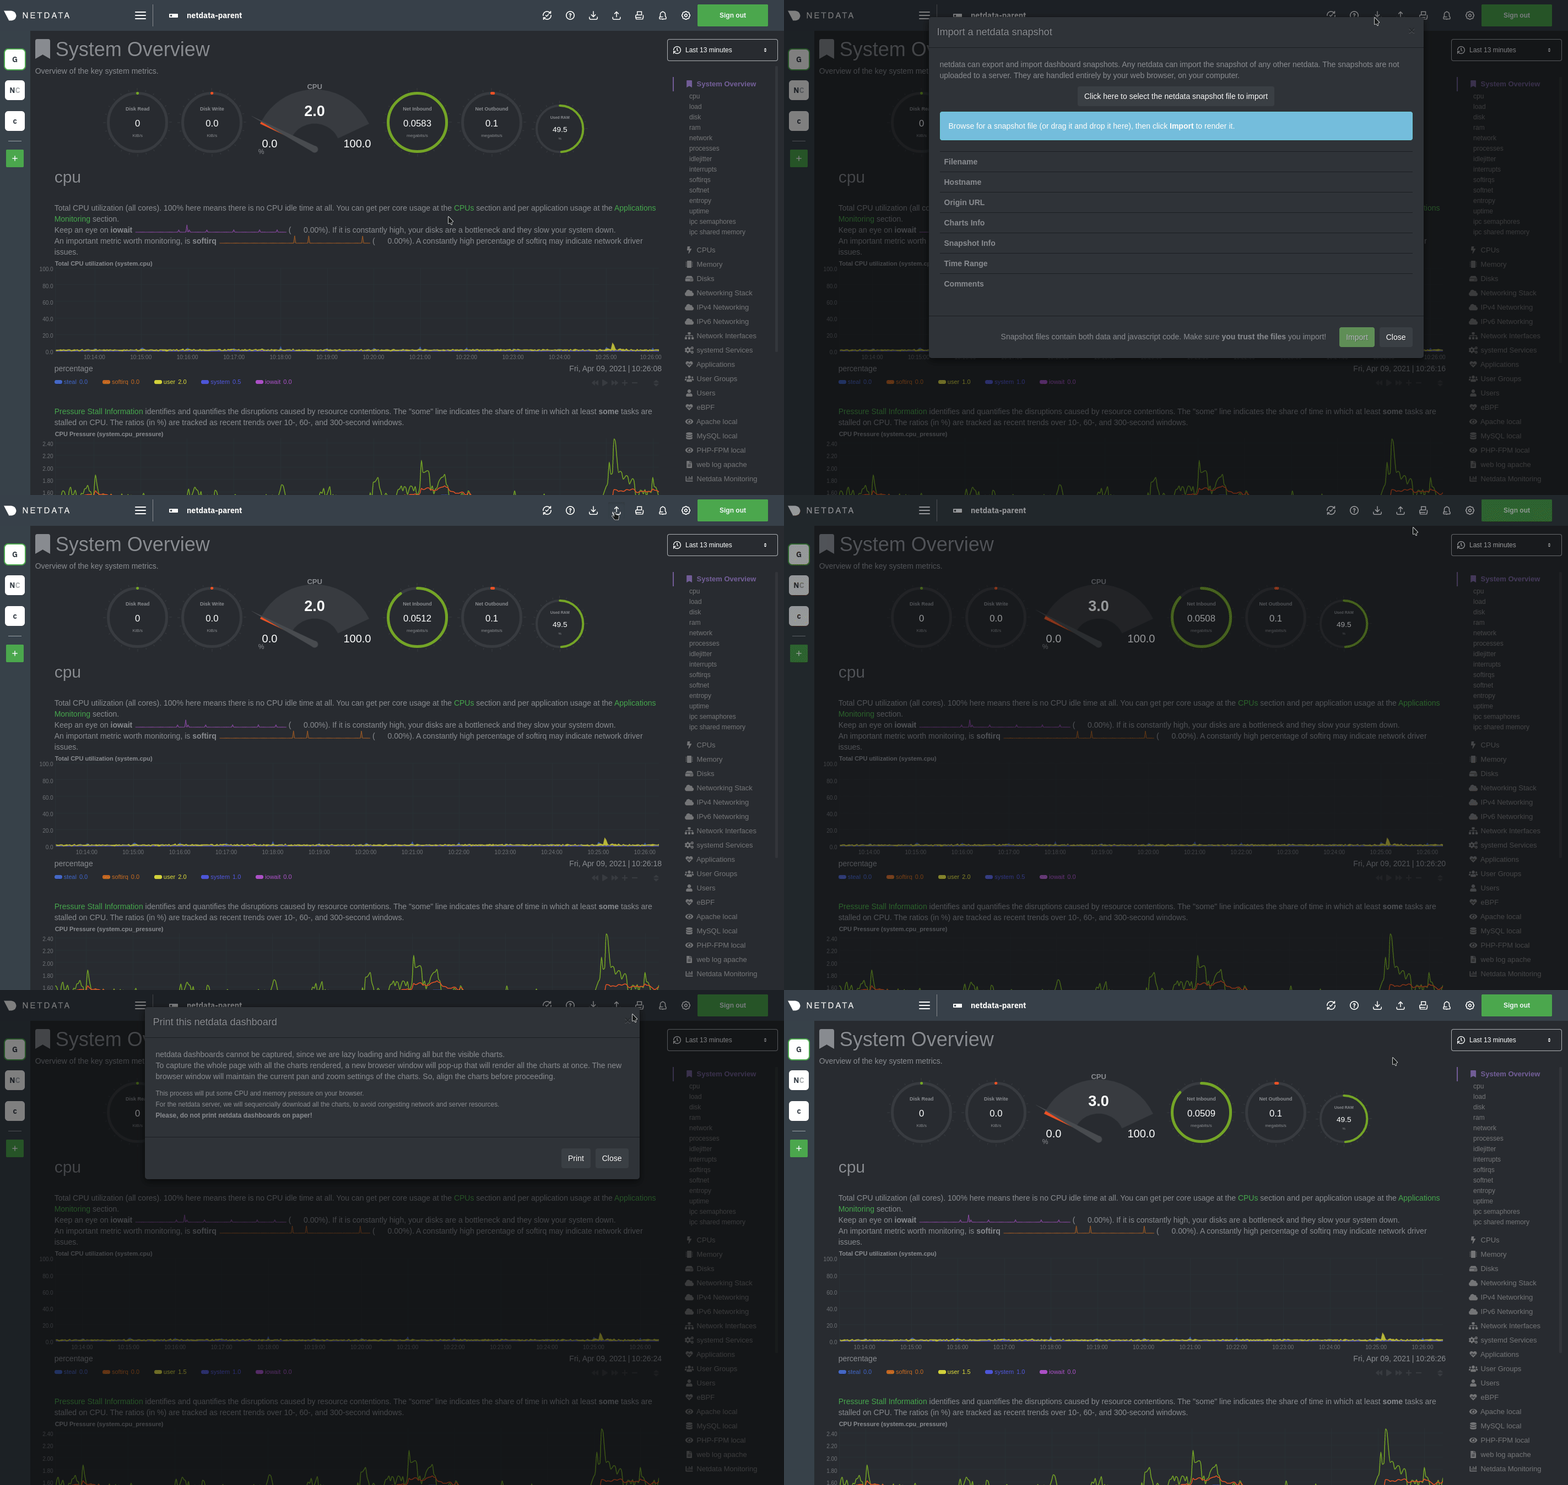 |
| 19 | |
| 20 | ## Import a snapshot |
| 21 | |
| 22 | To import a snapshot, click on the **import** icon  |
| 24 | in the top panel. |
| 25 | |
| 26 | Select the Netdata snapshot file to import. Once the file is loaded, the modal updates with information about the |
| 27 | snapshot and the system from which it was taken. Click **Import** to begin to process. |
| 28 | |
| 29 | Netdata takes the data embedded inside the snapshot and re-creates a static replica on your dashboard. When the import |
| 30 | finishes, you're free to move around and examine the charts. |
| 31 | |
| 32 | Some warnings and tips to keep in mind: |
| 33 | |
| 34 | - Only metrics in the export timeframe are available to you. If you zoom out or pan through time, you'll see the |
| 35 | beginning and end of the snapshot. |
| 36 | - Charts won't update with new information, as you're looking at a static replica, not the live dashboard. |
| 37 | - The import is only temporary. Reload your browser tab to return to your node's real-time dashboard. |
| 38 | |
| 39 | ## Export a snapshot |
| 40 | |
| 41 | To export a snapshot, first pan/zoom any chart to an appropriate _visible timeframe_. The export snapshot will only |
| 42 | contain the metrics you see in charts, so choose the most relevant timeframe. |
| 43 | |
| 44 | Next, click on the **export** icon  |
| 46 | in the top panel. |
| 47 | |
| 48 | Select the metrics resolution to export. The default is 1-second, equal to how often Netdata collects and stores |
| 49 | metrics. Lowering the resolution will reduce the number of data points, and thus the snapshot's overall size. |
| 50 | |
| 51 | Edit the snapshot file name and select your desired compression method. Click on **Export**. When the export is |
| 52 | complete, your browser will prompt you to save the `.snapshot` file to your machine. |
| 53 | |
| 54 | ## Print a snapshot |
| 55 | |
| 56 | To print a snapshot, click on the **print** icon  |
| 58 | in the top panel. |
| 59 | |
| 60 | When you click **Print**, Netdata opens a new window to render every chart. This might take some time. When finished, |
| 61 | Netdata opens a browser print dialog for you to save to PDF or print. |