| 1 | # Performance Optimization |
| 2 | |
| 3 | Find bottlenecks before users notice. The Performance Optimization report analyzes contention patterns, throttling risks, and systemic inefficiencies, then produces prioritized, concrete remediation steps tied to your observed workload. |
| 4 | |
| 5 | 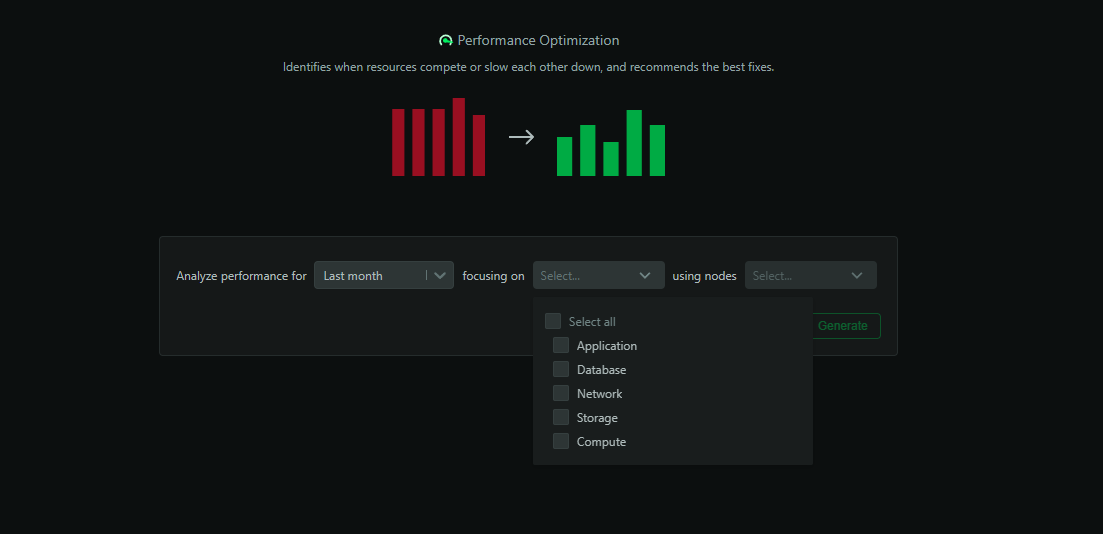 |
| 6 | |
| 7 | ## When to use it |
| 8 | |
| 9 | - Ongoing SRE/ops optimization workstreams |
| 10 | - After key deploys, major configuration changes, or scaling events |
| 11 | - To prepare proposals for performance investments or capacity changes |
| 12 | |
| 13 | ## How to generate |
| 14 | |
| 15 | 1. Open the `Insights` tab in Netdata Cloud |
| 16 | 2. Select `Performance Optimization` |
| 17 | 3. Choose a window (e.g., last 24h, 7d, 30d, or custom) |
| 18 | 4. Scope to infrastructure segments (rooms/spaces) or services of interest |
| 19 | 5. Click `Generate` |
| 20 | |
| 21 | ## What’s analyzed |
| 22 | |
| 23 | - CPU and memory saturation, noisy neighbors, and throttling signals |
| 24 | - Disk IO, queue depths, saturation ratios, filesystem pressure |
| 25 | - Network throughput, packet loss, retransmits, egress hot spots |
| 26 | - Container and pod throttling, OOM risks, scheduling pressure |
| 27 | - Database/service bottlenecks and backpressure evidence |
| 28 | |
| 29 | ## What you get |
| 30 | |
| 31 | - Ranked list of bottlenecks with severity and confidence |
| 32 | - Correlated signals to distinguish cause vs. symptom |
| 33 | - Specific tuning and right‑sizing recommendations |
| 34 | - Expected impact estimates where feasible (latency/throughput) |
| 35 | - Before/after projections for planned changes (when applicable) |
| 36 | |
| 37 | 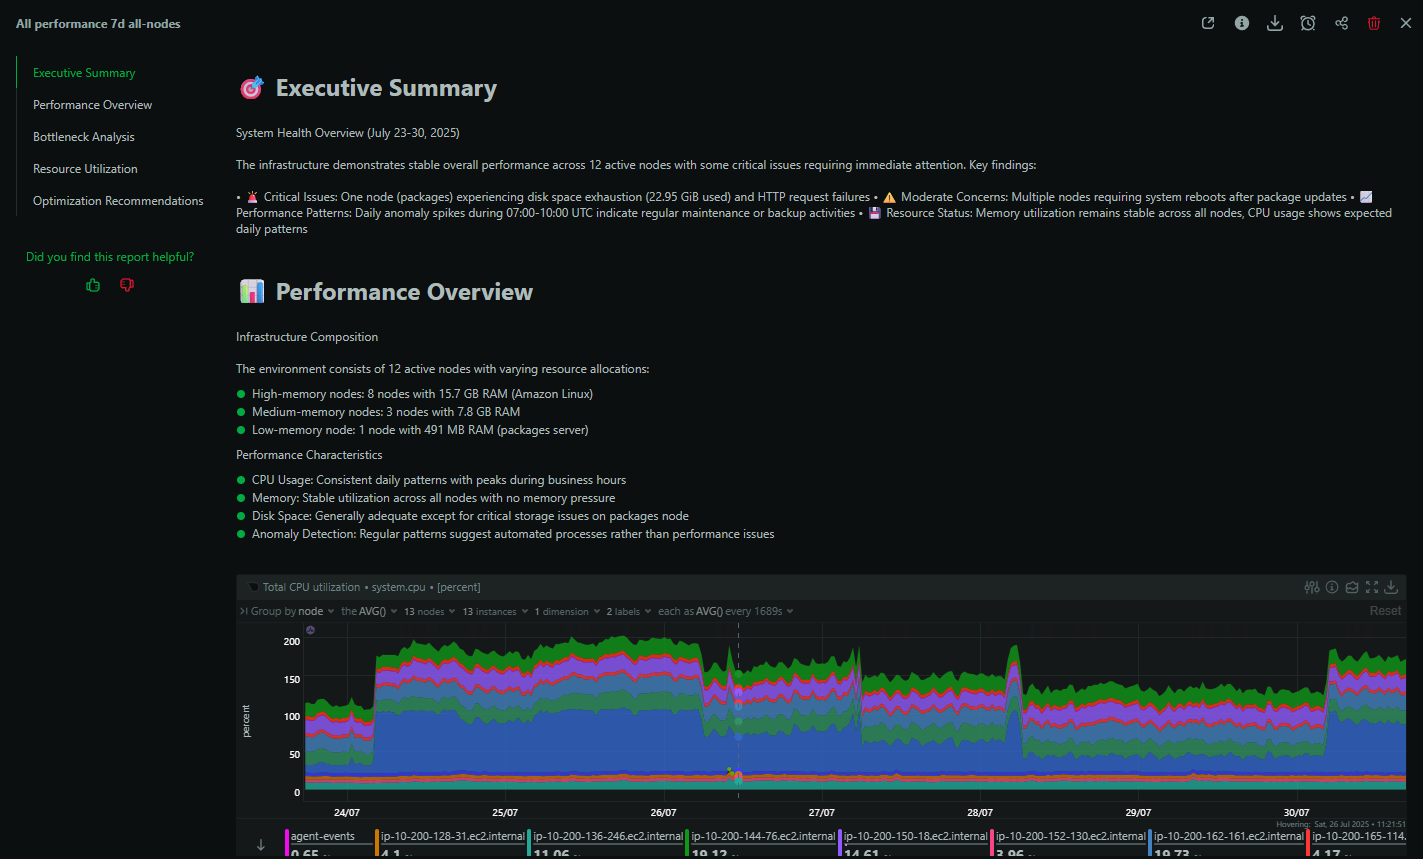 |
| 38 | |
| 39 | ## Example: Debugging Kubernetes performance |
| 40 | |
| 41 | An SRE investigating cluster slowness sees synthesized findings about container throttling, resource contention on specific nodes, and recommended limit/request adjustments—with nodes and workloads called out explicitly. |
| 42 | |
| 43 | ## Best practices |
| 44 | |
| 45 | - Run monthly for baselining; run ad‑hoc after notable changes |
| 46 | - Use findings to drive tickets with clear owners and measurable goals |
| 47 | - Combine with `Capacity Planning` for a balanced performance/cost view |
| 48 | |
| 49 | ## Availability and usage |
| 50 | |
| 51 | - Available on Business and Free Trial plans |
| 52 | - Each report consumes 1 AI credit (10 free per month on eligible plans) |
| 53 | - Results are saved in Insights and downloadable as PDFs |
| 54 |