| 1 | # Custom Investigations |
| 2 | |
| 3 | Create deeply researched, context‑aware analyses by asking Netdata open‑ended questions about your infrastructure. Custom Investigations correlate metrics, anomalies, and events to answer the questions dashboards can’t—typically in about two minutes. |
| 4 | |
| 5 | 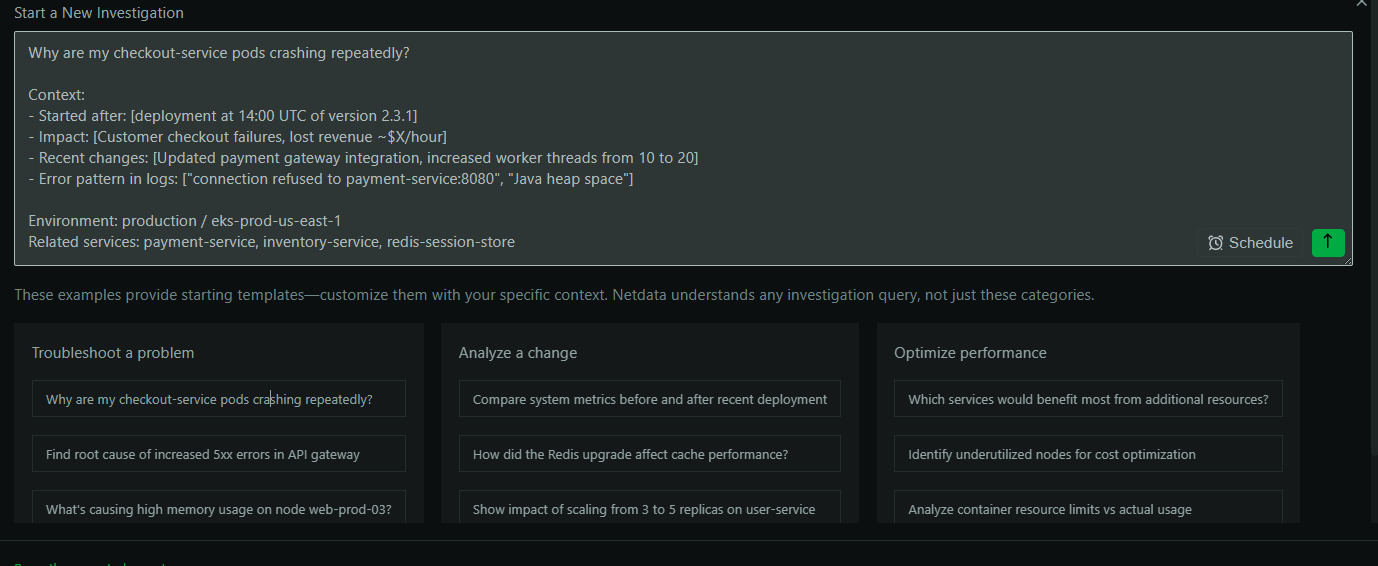 |
| 6 | |
| 7 | ## When to use Custom Investigations |
| 8 | |
| 9 | - Troubleshoot complex incidents by delegating parallel investigations |
| 10 | - Analyze deployment or configuration change impact (before/after) |
| 11 | - Optimize performance and cost (identify underutilization and hotspots) |
| 12 | - Explore longer‑term behavioral changes and trends |
| 13 | |
| 14 | ## Start an investigation |
| 15 | |
| 16 | Two ways to launch: |
| 17 | |
| 18 | - From anywhere: Click `Troubleshoot with AI` (top‑right). The current view’s scope (chart, dashboard, room, service) is captured automatically; add your question and context. |
| 19 | - From Insights: Go to `Insights` → `New Investigation` for a blank canvas and full control. |
| 20 | |
| 21 | Reports are saved in Insights and you’ll receive an email when ready. |
| 22 | |
| 23 | ## Provide good context (get great results) |
| 24 | |
| 25 | Think of this as briefing a teammate. Include time ranges, environments, related services, symptoms, and recent changes. |
| 26 | |
| 27 | ### Example 1: Troubleshooting a problem |
| 28 | Request: Why are my checkout‑service pods crashing repeatedly? |
| 29 | |
| 30 | Context: |
| 31 | ``` |
| 32 | - Started after: deployment at 14:00 UTC of version 2.3.1 |
| 33 | - Impact: Customer checkout failures, lost revenue ~$X/hour |
| 34 | - Recent changes: payment gateway integration update; workers 10→20 |
| 35 | - Logs: "connection refused to payment-service:8080", "Java heap space" |
| 36 | - Environment: production / eks-prod-us-east-1 |
| 37 | - Related: payment-service, inventory-service, redis-session-store |
| 38 | ``` |
| 39 | |
| 40 | ### Example 2: Analyze a change |
| 41 | Request: Compare system metrics before and after the user‑authentication‑service deployment. |
| 42 | |
| 43 | Context: |
| 44 | ``` |
| 45 | - Service: user-authentication-service v2.2.0 |
| 46 | - Deployed: 2025‑01‑24 09:00 UTC |
| 47 | - Changes: JWT→Redis sessions; Argon2 hashing |
| 48 | - Concern: intermittent logouts; rising redis_connected_clients |
| 49 | - Windows: 24h before vs 24h after |
| 50 | ``` |
| 51 | |
| 52 | ### Example 3: Cost optimization |
| 53 | Request: Identify underutilized nodes for cost optimization. |
| 54 | |
| 55 | Context: |
| 56 | ``` |
| 57 | - Monthly compute: ~$12K |
| 58 | - Mixed workloads (prod + staging) |
| 59 | - Dev envs run 24/7; batch nodes idle 20h/day |
| 60 | - Goal: save $2–3K/month without reliability impact |
| 61 | ``` |
| 62 | |
| 63 | ## Best practices |
| 64 | |
| 65 | 1. Be specific: timeframe, environment, services |
| 66 | 2. Add helpful context from tickets/Slack/deploy logs |
| 67 | 3. Set clear goals (reduce costs, find root cause, etc.) |
| 68 | 4. Run multiple investigations in parallel during incidents |
| 69 | |
| 70 | 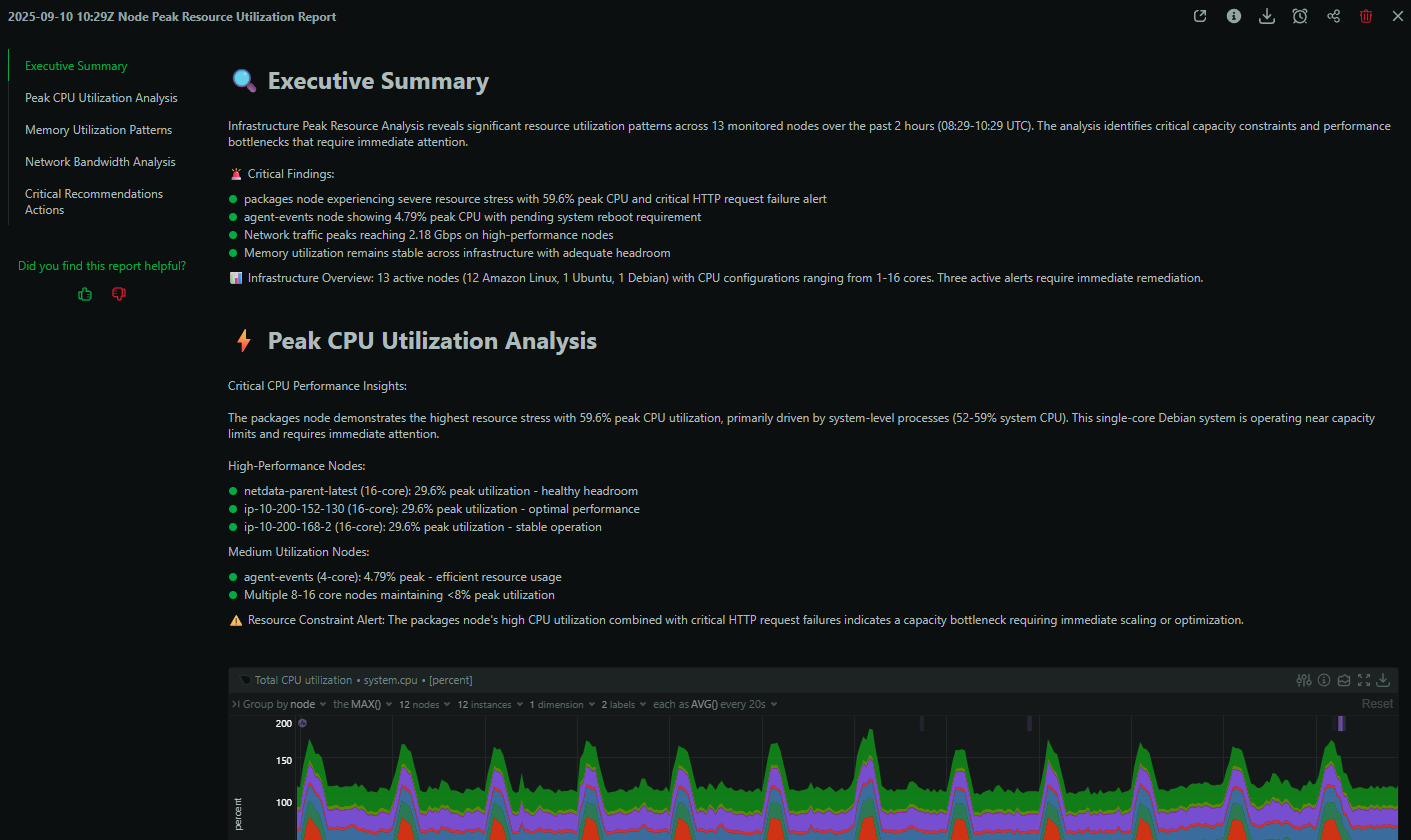 |
| 71 | |
| 72 | ## Scheduling |
| 73 | |
| 74 | Automate recurring investigations (weekly health, monthly optimization, SLO conformance) from the `Insights` tab. See `Scheduled Investigations` for examples and setup. |
| 75 | |
| 76 | ## Availability and credits |
| 77 | |
| 78 | - Generally available in Netdata Cloud (Business and Free Trial) |
| 79 | - Eligible Spaces receive 10 free AI runs per month; additional usage via AI Credits |
| 80 | - Track usage in `Settings → Usage & Billing → AI Credits` |
| 81 | |
| 82 | ## Related |
| 83 | |
| 84 | - `Investigations` overview |
| 85 | - `Scheduled Investigations` |
| 86 | - `Alert Troubleshooting` |
| 87 |