| 1 | import Tabs from '@theme/Tabs'; |
| 2 | import TabItem from '@theme/TabItem'; |
| 3 | |
| 4 | # Install Netdata on Kubernetes |
| 5 | |
| 6 | This document details how to install Netdata on an existing Kubernetes (k8s) cluster, and connect it to Netdata Cloud. |
| 7 | |
| 8 | Read our [Kubernetes visualizations](/docs/dashboards-and-charts/kubernetes-tab.md) documentation, to see what you will get. |
| 9 | |
| 10 | The [Netdata Helm chart](https://github.com/netdata/helmchart/blob/master/charts/netdata/README.md) installs one `parent` pod for storing metrics and managing alert notifications, plus an additional `child` pod for every node in the cluster, responsible for collecting metrics from the node, Kubernetes control planes, pods/containers, and [supported application-specific metrics](https://github.com/netdata/helmchart#service-discovery-and-supported-services). |
| 11 | |
| 12 | ## Prerequisites |
| 13 | |
| 14 | To deploy Kubernetes monitoring with Netdata, you'll need: |
| 15 | |
| 16 | - A working cluster running Kubernetes v1.9 or newer. |
| 17 | - The [kubectl](https://kubernetes.io/docs/reference/kubectl/overview/) command line tool, within [one minor version difference](https://kubernetes.io/docs/tasks/tools/install-kubectl/#before-you-begin) of your cluster, on an administrative system. |
| 18 | - The [Helm package manager](https://helm.sh/) v3.0.0 or newer on the same administrative system. |
| 19 | - A Netdata Cloud account with a Space to connect the cluster to. |
| 20 | |
| 21 | ## Deploy Netdata on your Kubernetes Cluster |
| 22 | |
| 23 | First, you need to add the Netdata helm repository, and then install Netdata. |
| 24 | The installation process securely connects your Kubernetes cluster to stream metrics data to Netdata Cloud, enabling Kubernetes-specific visualizations like the health map and time-series composite charts. |
| 25 | |
| 26 | <Tabs groupId="installation_type"> |
| 27 | <TabItem value="new_installations" label="New Installations"> |
| 28 | |
| 29 | <h3> Install Netdata via the <code>helm install</code> command </h3> |
| 30 | |
| 31 | #### Steps |
| 32 | |
| 33 | 1. Add the Netdata Helm chart repository by running: |
| 34 | |
| 35 | ```bash |
| 36 | helm repo add netdata https://netdata.github.io/helmchart/ |
| 37 | ``` |
| 38 | |
| 39 | 2. To install Netdata using the `helm install` command, run: |
| 40 | |
| 41 | ```bash |
| 42 | helm install netdata netdata/netdata |
| 43 | ``` |
| 44 | |
| 45 | :::note |
| 46 | |
| 47 | If you plan to connect the node to Netdata Cloud, you can find the command with the right parameters by clicking the "Add Nodes" button in your Space's Nodes tab. |
| 48 | |
| 49 | ::: |
| 50 | |
| 51 | For more installation options, please read our [Netdata Helm chart for Kubernetes](https://github.com/netdata/helmchart/blob/master/charts/netdata/README.md) reference. |
| 52 | |
| 53 | #### Expected Result |
| 54 | |
| 55 | Run `kubectl get services` and `kubectl get pods` to confirm that your cluster now runs a `netdata` service, one parent pod, and multiple child pods. |
| 56 | |
| 57 | </TabItem> |
| 58 | <TabItem value="existing_installations" label="Existing Installations"> |
| 59 | |
| 60 | <h3> Connect an existing Netdata installation to Netdata Cloud </h3> |
| 61 | |
| 62 | On an existing installation, in order to connect it to Netdata Cloud you will need to override the configuration values by running the `helm upgrade` command and provide a file with the values to override. |
| 63 | |
| 64 | #### Steps |
| 65 | |
| 66 | 1. You can start with creating a file called `override.yml` |
| 67 | |
| 68 | ```bash |
| 69 | touch override.yml |
| 70 | ``` |
| 71 | |
| 72 | 2. Paste the following into your `override.yml` file. |
| 73 | |
| 74 | ```yaml |
| 75 | parent: |
| 76 | claiming: |
| 77 | enabled: true |
| 78 | token: YOUR_CLAIM_TOKEN |
| 79 | rooms: YOUR_ROOM_ID_A,YOUR_ROOM_ID_B |
| 80 | |
| 81 | child: |
| 82 | claiming: |
| 83 | enabled: true |
| 84 | token: YOUR_CLAIM_TOKEN |
| 85 | rooms: YOUR_ROOM_ID_A,YOUR_ROOM_ID_B |
| 86 | configs: |
| 87 | netdata: |
| 88 | data: | |
| 89 | [db] |
| 90 | db = ram |
| 91 | retention = 3600 |
| 92 | [health] |
| 93 | enabled = no |
| 94 | ``` |
| 95 | |
| 96 | :::note |
| 97 | |
| 98 | Make sure to replace `YOUR_CLAIM_TOKEN` with the claim token of your space, |
| 99 | and `YOUR_ROOM_ID` with the ID of the Room you are willing to connect to. |
| 100 | |
| 101 | ::: |
| 102 | |
| 103 | These settings connect your `parent`/`child` nodes to Netdata Cloud and store more metrics in the nodes' time-series databases. |
| 104 | |
| 105 | :::info |
| 106 | |
| 107 | These override settings, along with the Helm chart's defaults, will retain an hour's worth of metrics (`retention = 3600`, or `3600 seconds`) on each child node. Based on your metrics retention needs, and the resources available on your cluster, you may want to increase the `history` setting. |
| 108 | |
| 109 | ::: |
| 110 | |
| 111 | 3. To apply these new settings, run: |
| 112 | |
| 113 | ```bash |
| 114 | helm upgrade -f override.yml netdata netdata/netdata |
| 115 | ``` |
| 116 | |
| 117 | #### Expected Result |
| 118 | |
| 119 | The cluster terminates the old pods and creates new ones with the proper persistence and connection configuration. You'll see your nodes, containers, and pods appear in Netdata Cloud in a few seconds. |
| 120 | |
| 121 | </TabItem> |
| 122 | </Tabs> |
| 123 | |
| 124 | 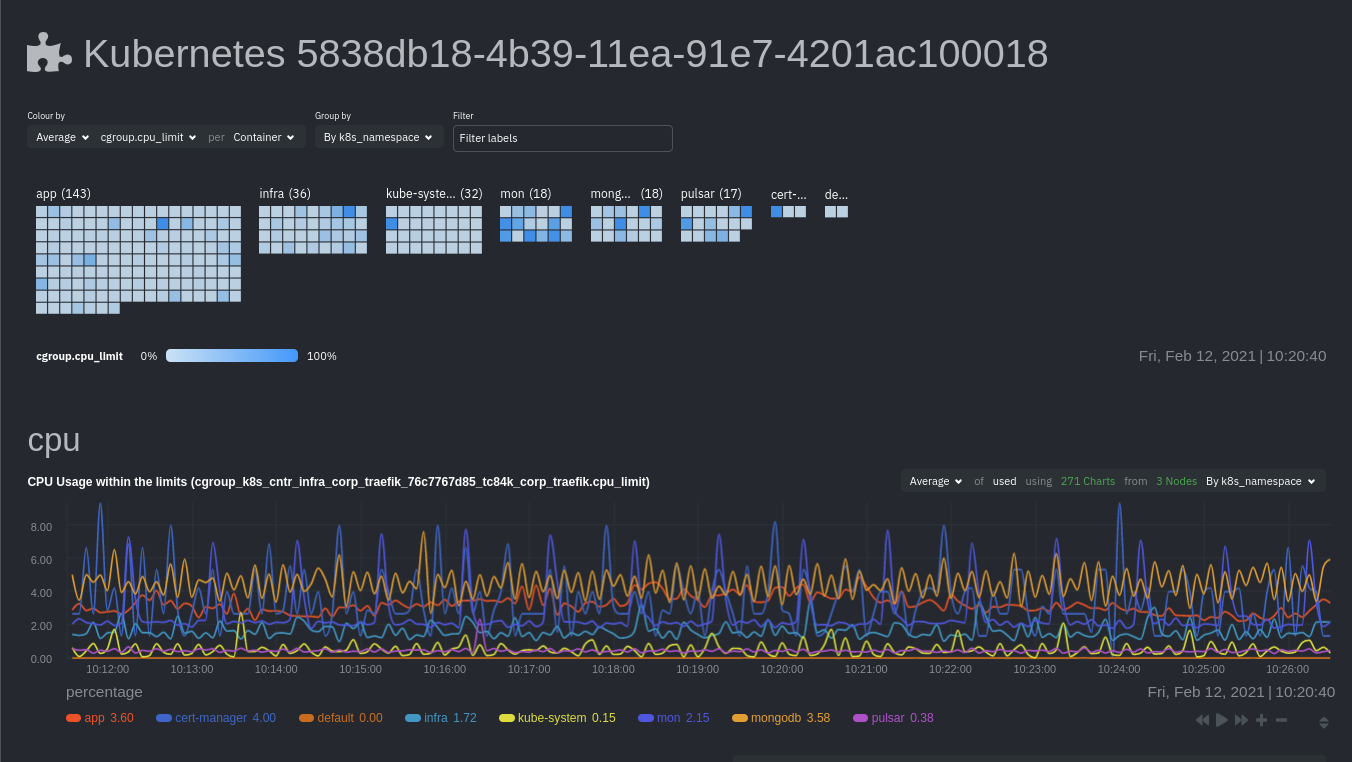 |
| 125 | |
| 126 | ## Configure your Netdata monitoring deployment |
| 127 | |
| 128 | Read up on the various configuration options in the [Helm chart |
| 129 | documentation](https://github.com/netdata/helmchart#configuration) if you need to tweak your Kubernetes monitoring. |
| 130 | |
| 131 | Your first option is to create an `override.yml` file, if you haven't created one already upon [deploying](#deploy-netdata-on-your-kubernetes-cluster), then apply the new configuration to your cluster with `helm |
| 132 | upgrade`. |
| 133 | |
| 134 | ```bash |
| 135 | helm upgrade -f override.yml netdata netdata/netdata |
| 136 | ``` |
| 137 | |
| 138 | If you want to change only a single setting, use the `--set` argument with `helm upgrade`. For example, to change the |
| 139 | size of the persistent metrics volume on the parent node: |
| 140 | |
| 141 | ```bash |
| 142 | helm upgrade --set parent.database.volumesize=4Gi netdata netdata/netdata |
| 143 | ``` |
| 144 | |
| 145 | ### Configure service discovery |
| 146 | |
| 147 | Netdata's [service discovery](https://github.com/netdata/agent-service-discovery/#service-discovery), installed as part |
| 148 | of the Helm chart installation, finds what services are running in a cluster's containers and automatically collects |
| 149 | service-level metrics from them. |
| 150 | |
| 151 | Service discovery supports [popular applications](https://github.com/netdata/helmchart#applications) and [Prometheus endpoints](https://github.com/netdata/helmchart#prometheus-endpoints). |
| 152 | |
| 153 | If your cluster runs services on non-default ports or uses non-default names, you may need to configure service |
| 154 | discovery to start collecting metrics from your services. You have to edit the default ConfigMap that is shipped with |
| 155 | the Helmchart and deploy that to your cluster. |
| 156 | |
| 157 | First, copy the default file to your administrative system. |
| 158 | |
| 159 | ```bash |
| 160 | curl https://raw.githubusercontent.com/netdata/helmchart/master/charts/netdata/sdconfig/child.yml -o child.yml |
| 161 | ``` |
| 162 | |
| 163 | Edit the new `child.yml` file according to your needs. See the [Helm chart configuration](https://github.com/netdata/helmchart#configuration) and the file itself for details. |
| 164 | |
| 165 | You can then run `helm upgrade` with the `--set-file` argument to use your configured `child.yml` file instead of the |
| 166 | default, changing the path if you copied it elsewhere. |
| 167 | |
| 168 | ```bash |
| 169 | helm upgrade --set-file sd.child.configmap.from.value=./child.yml netdata netdata/netdata |
| 170 | ``` |
| 171 | |
| 172 | Now that you pushed an edited ConfigMap to your cluster, service discovery should find and set up metrics collection |
| 173 | from your non-default service. |
| 174 | |
| 175 | ## Update/reinstall the Netdata Helm chart |
| 176 | |
| 177 | If you update the Helm chart's configuration, run `helm upgrade` to redeploy your Netdata service, replacing `netdata` |
| 178 | with the name of the release, if you changed it upon installation: |
| 179 | |
| 180 | ```bash |
| 181 | helm upgrade netdata netdata/netdata |
| 182 | ``` |
| 183 | |
| 184 | To update Netdata's Helm chart to the latest version, run `helm repo update`, then deploy `upgrade` it`: |
| 185 | |
| 186 | ```bash |
| 187 | helm repo update |
| 188 | helm upgrade netdata netdata/netdata |
| 189 | ``` |