| 1 | # K6 load test collector |
| 2 | |
| 3 | Monitors the impact of load testing experiments performed with [K6](https://k6.io/). |
| 4 | |
| 5 | You can read more about the metrics that K6 sends in the [K6 documentation](https://k6.io/docs/using-k6/metrics/). |
| 6 | |
| 7 | ## Requirements |
| 8 | |
| 9 | - When running the k6 experiment, specify a [StatsD output](https://k6.io/docs/results-visualization/statsd/). |
| 10 | - Tip: K6 currently supports tags only with [datadog output](https://k6.io/docs/results-visualization/datadog/), which is in essence StatsD. Netdata can be used with both. |
| 11 | |
| 12 | ## Metrics |
| 13 | |
| 14 | 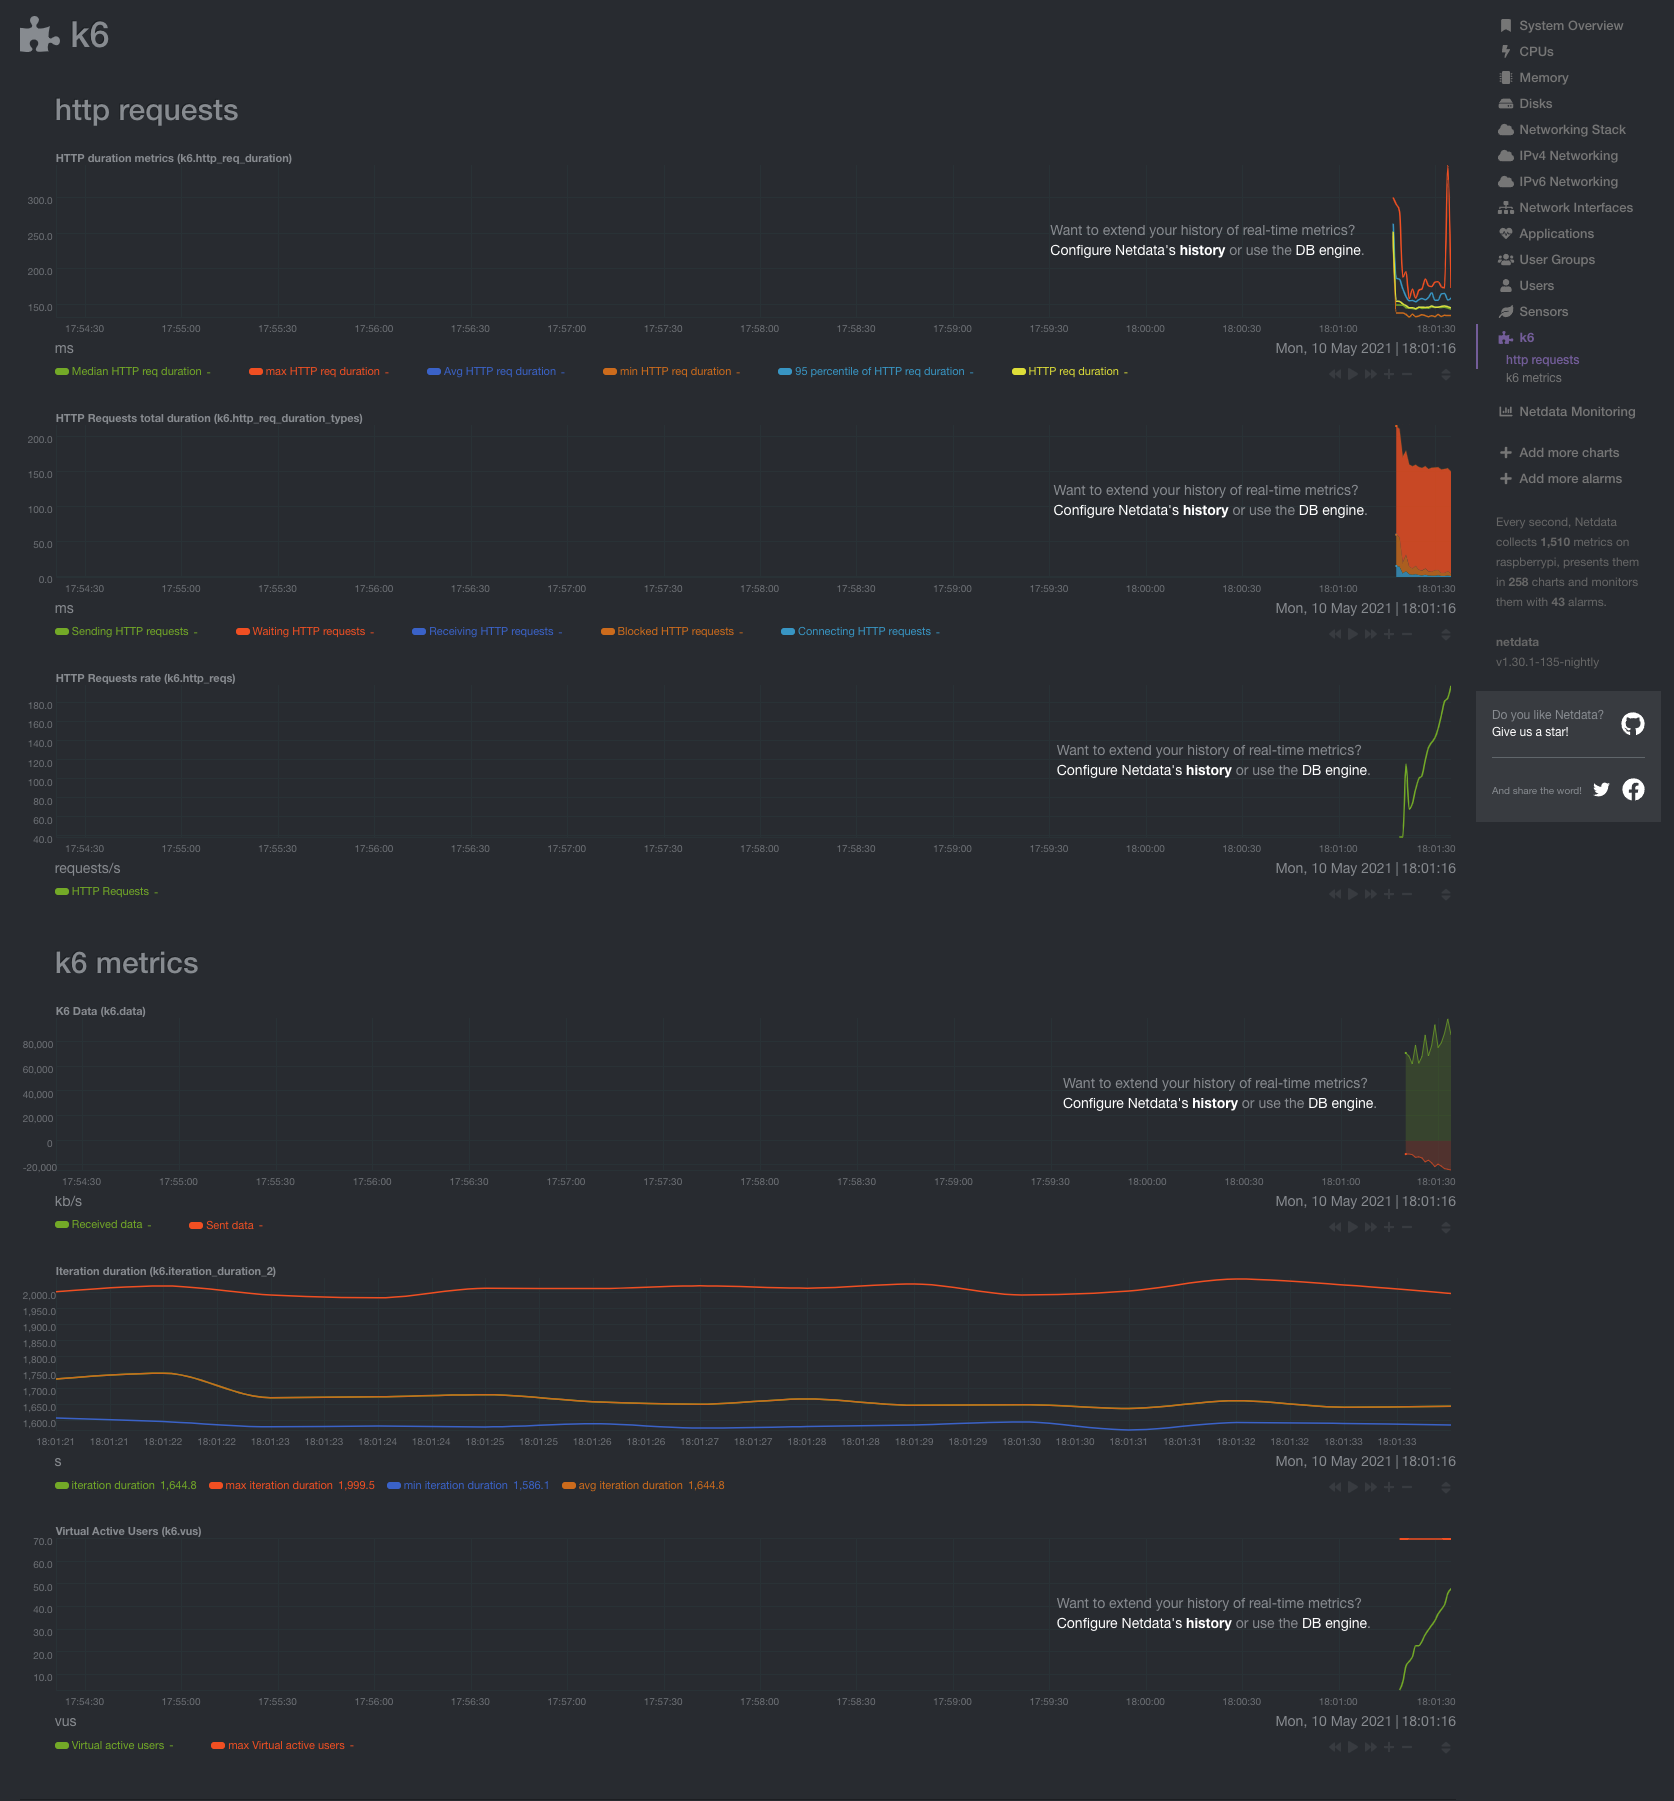 |
| 15 | |
| 16 | |
| 17 | ### HTTP Requests |
| 18 | |
| 19 | Number of HTTP requests that K6 generates, per second. |
| 20 | |
| 21 | ### Failed HTTP Requests |
| 22 | |
| 23 | Number of failed HTTP requests that K6 generates, per second. |
| 24 | |
| 25 | ### Virtual Active Users |
| 26 | Current number of active virtual users. |
| 27 | |
| 28 | ### Iteration Duration |
| 29 | |
| 30 | The time it took K6 to complete one full iteration of the main function. |
| 31 | |
| 32 | ### Dropped Iterations |
| 33 | |
| 34 | The number of iterations that could not be started either due to lack of Virtual Users or lack of time. |
| 35 | |
| 36 | ### Data |
| 37 | |
| 38 | The amount of data received and sent. |
| 39 | |
| 40 | ### TTP Requests total duration |
| 41 | |
| 42 | The total duration it took for a round-trip of an HTTP request. It includes: |
| 43 | - Blocked HTTP requests: time spent blocked before initiating the request |
| 44 | - Connecting HTTP requests: time spent establishing TCP connection to the remote host |
| 45 | - Sending HTTP requests: time spent sending data to the remote host |
| 46 | - Receiving HTTP requests: time spent receiving data from the remote host |
| 47 | - Waiting HTTP requests: time spent waiting for response from the remote host |
| 48 | |
| 49 | ### HTTP duration metrics |
| 50 | |
| 51 | Different metrics on the HTTP request as defined by K6. The HTTP request duration is defined by K6 as: `HTTP sending request` + `HTTP receiving request` + `HTTP waiting request`. |
| 52 | |
| 53 | Metrics: |
| 54 | - Median |
| 55 | - Average |
| 56 | - Max |
| 57 | - Min |
| 58 | - 95th percentile |
| 59 | - absolute (the value as it is, without any computation) |
| 60 | |
| 61 | ## Configuration |
| 62 | |
| 63 | The collector is preconfigured and defined in `statsd.plugin/k6.conf`. |
| 64 | |
| 65 | Due to being a StatsD collector, you only need to define the configuration file and then send data to Netdata using the StatsD protocol. |
| 66 | |
| 67 | If Netdata is running on the same machine as K6, no further configuration is required. Otherwise, you will have to [point K6](https://k6.io/docs/results-visualization/statsd/) to your node and make sure that the K6 process can reach Netdata. |
| 68 | |
| 69 | The default namespace that is used in the configuration is `k6`. If you change it in K6, you will have to change it as well in the configuration file `k6.conf`. |