| 1 | # `systemd` journal plugin |
| 2 | |
| 3 | [KEY FEATURES](#key-features) | [PREREQUISITES](#prerequisites) | [JOURNAL SOURCES](#journal-sources) | [JOURNAL FIELDS](#journal-fields) | [VISUALIZATION](#visualization-capabilities) | [PLAY MODE](#play-mode) | [FULL TEXT SEARCH](#full-text-search) | [QUERY PERFORMANCE](#query-performance) | [PERFORMANCE AT SCALE](#performance-at-scale) | [BEST PRACTICES](#best-practices-for-better-performance) | [CONFIGURATION](#configuration-and-maintenance) | [FAQ](#faq) | [HOW TO TROUBLESHOOT COMMON ISSUES](#how-to-troubleshoot-common-issues) | [HOW TO VERIFY SETUP](#how-to-verify-setup) |
| 4 | |
| 5 | The `systemd` journal plugin provides an efficient way to view, explore, and analyze `systemd` journal logs directly from the Netdata dashboard. It combines powerful filtering, real-time updates, and visual analysis tools to help you troubleshoot system issues effectively. |
| 6 | |
| 7 | 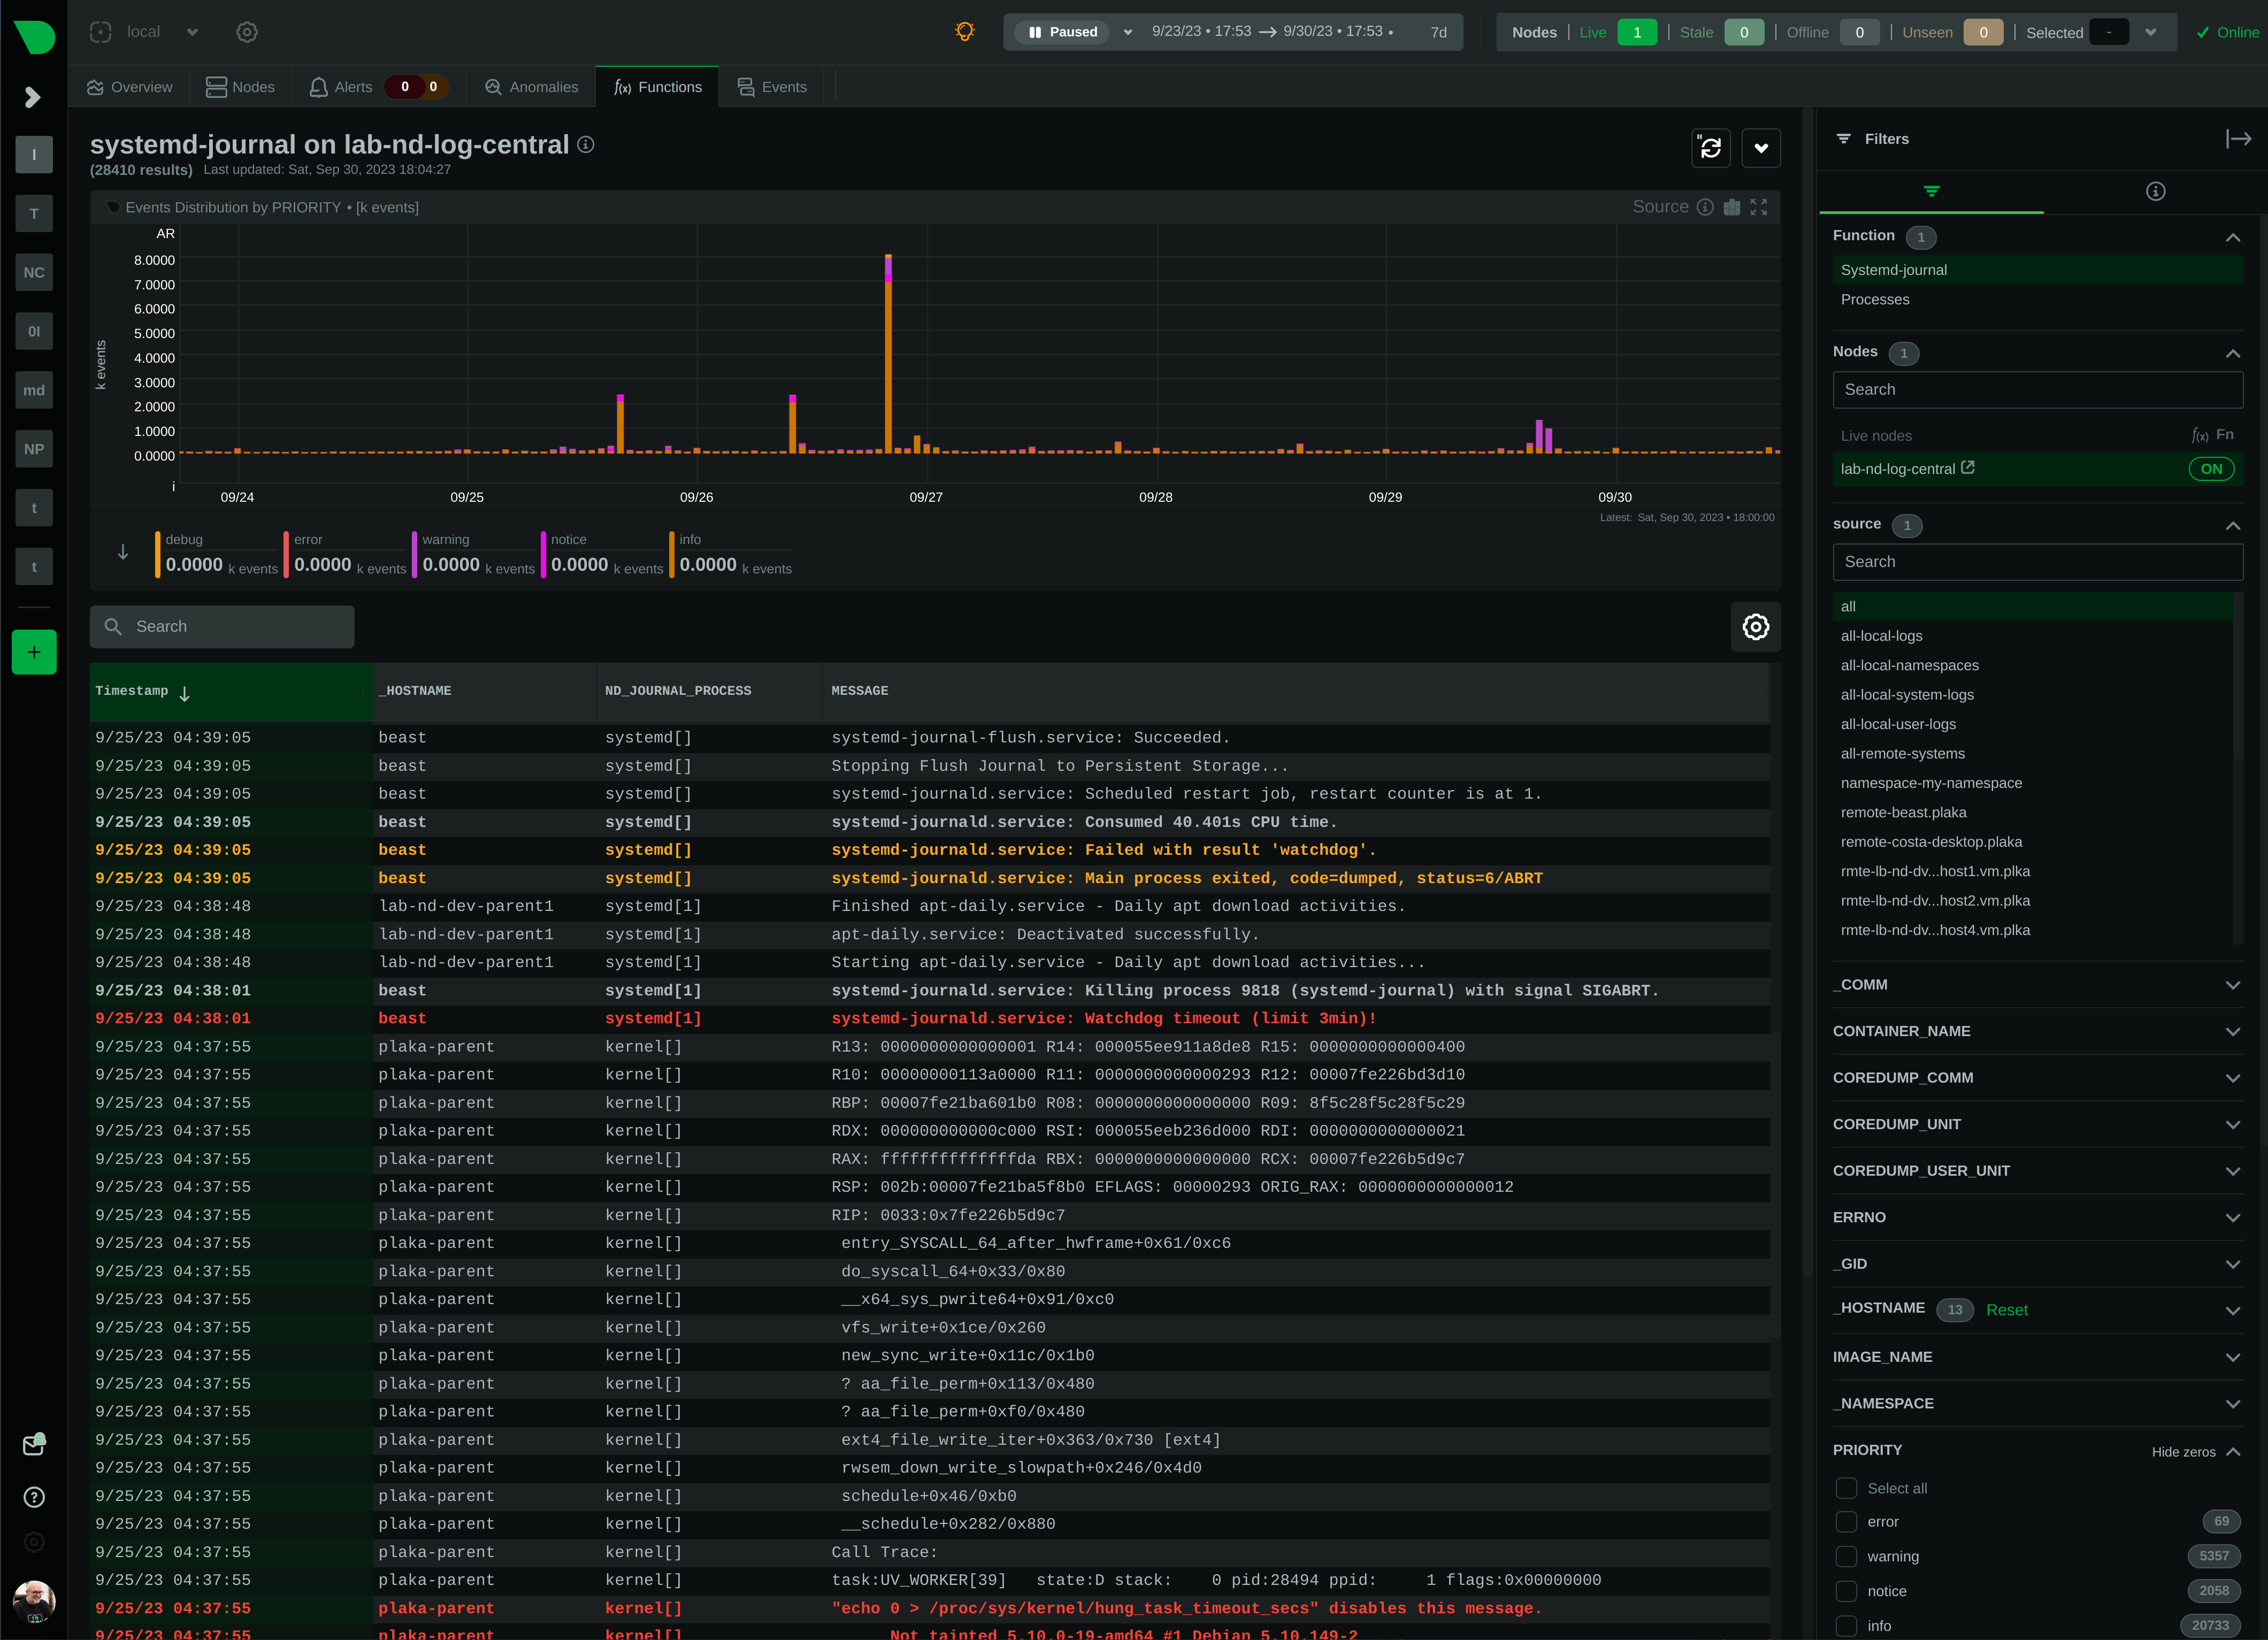 |
| 8 | |
| 9 | ## Key features |
| 10 | |
| 11 | - **Unified view of logs** from multiple sources (system, user, namespace, remote) |
| 12 | - **Real-time streaming** with PLAY mode for continuous monitoring |
| 13 | - **Powerful filtering** on all journal fields with counters showing matching entries |
| 14 | - **Full-text search** with wildcard and pattern matching |
| 15 | - **Visual analysis** with interactive histograms showing log frequency |
| 16 | - **Enriched field display** for improved readability (priorities, UIDs, timestamps) |
| 17 | - **High performance** with intelligent sampling for large datasets |
| 18 | - **Zero configuration** for immediate use on supported systems |
| 19 | - **Multi-node support** for centralized log analysis |
| 20 | - **UI-based exploration** without needing to learn complex journalctl syntax |
| 21 | - **Integrated with Netdata's dashboard** for correlation with metrics |
| 22 | |
| 23 | ## Prerequisites |
| 24 | |
| 25 | | Requirement | Details | |
| 26 | |-------------|---------| |
| 27 | | Netdata Agent v1.44+ | This plugin requires Netdata version 1.44 or newer | |
| 28 | | Netdata Cloud account | Required to use Netdata Functions, including this plugin | |
| 29 | | **Not supported in**: | Static builds (use Debian-based containers instead) | |
| 30 | |
| 31 | :::tip |
| 32 | |
| 33 | This plugin is a Netdata Function Plugin. A free Netdata Cloud account is required. See the [Netdata Functions discussion](https://github.com/netdata/netdata/discussions/16136). |
| 34 | |
| 35 | ::: |
| 36 | |
| 37 | The plugin is designed for native package installations, source installations, and Docker installations (Debian-based). If using Docker, make sure you're using the Debian-based containers. |
| 38 | |
| 39 | ## Offline Function test mode |
| 40 | |
| 41 | Fixture harnesses can execute the Function query path directly against an existing |
| 42 | journal directory: |
| 43 | |
| 44 | ```sh |
| 45 | systemd-journal.plugin --test systemd-journal --dir <journal-dir> [--timeout <seconds>] < payload.json |
| 46 | ``` |
| 47 | |
| 48 | Requirements: |
| 49 | |
| 50 | - `<journal-dir>` is scanned recursively for systemd journal files. |
| 51 | - stdin is the JSON Function request body (non-empty, maximum 16 MiB). |
| 52 | - `--request` is not supported and fails with usage output. |
| 53 | - `--timeout <seconds>` controls the offline Function execution timeout. It |
| 54 | defaults to `60`; use `--timeout 0` to map to a very large finite timeout for |
| 55 | long-running fixture comparisons. |
| 56 | - stdout contains only the raw JSON Function response. |
| 57 | - errors are written to stderr and return non-zero. |
| 58 | |
| 59 | For example, an info request can use this payload: |
| 60 | |
| 61 | ```json |
| 62 | {"info":true} |
| 63 | ``` |
| 64 | |
| 65 | Function output includes volatile fields such as versions and timing-derived values. |
| 66 | Test harnesses should normalize those fields before comparing fixture outputs. |
| 67 | |
| 68 | ## Journal sources |
| 69 | |
| 70 | The plugin automatically detects available journal sources based on the journal files in `/var/log/journal` (persistent logs) and `/run/log/journal` (volatile logs). |
| 71 | |
| 72 | 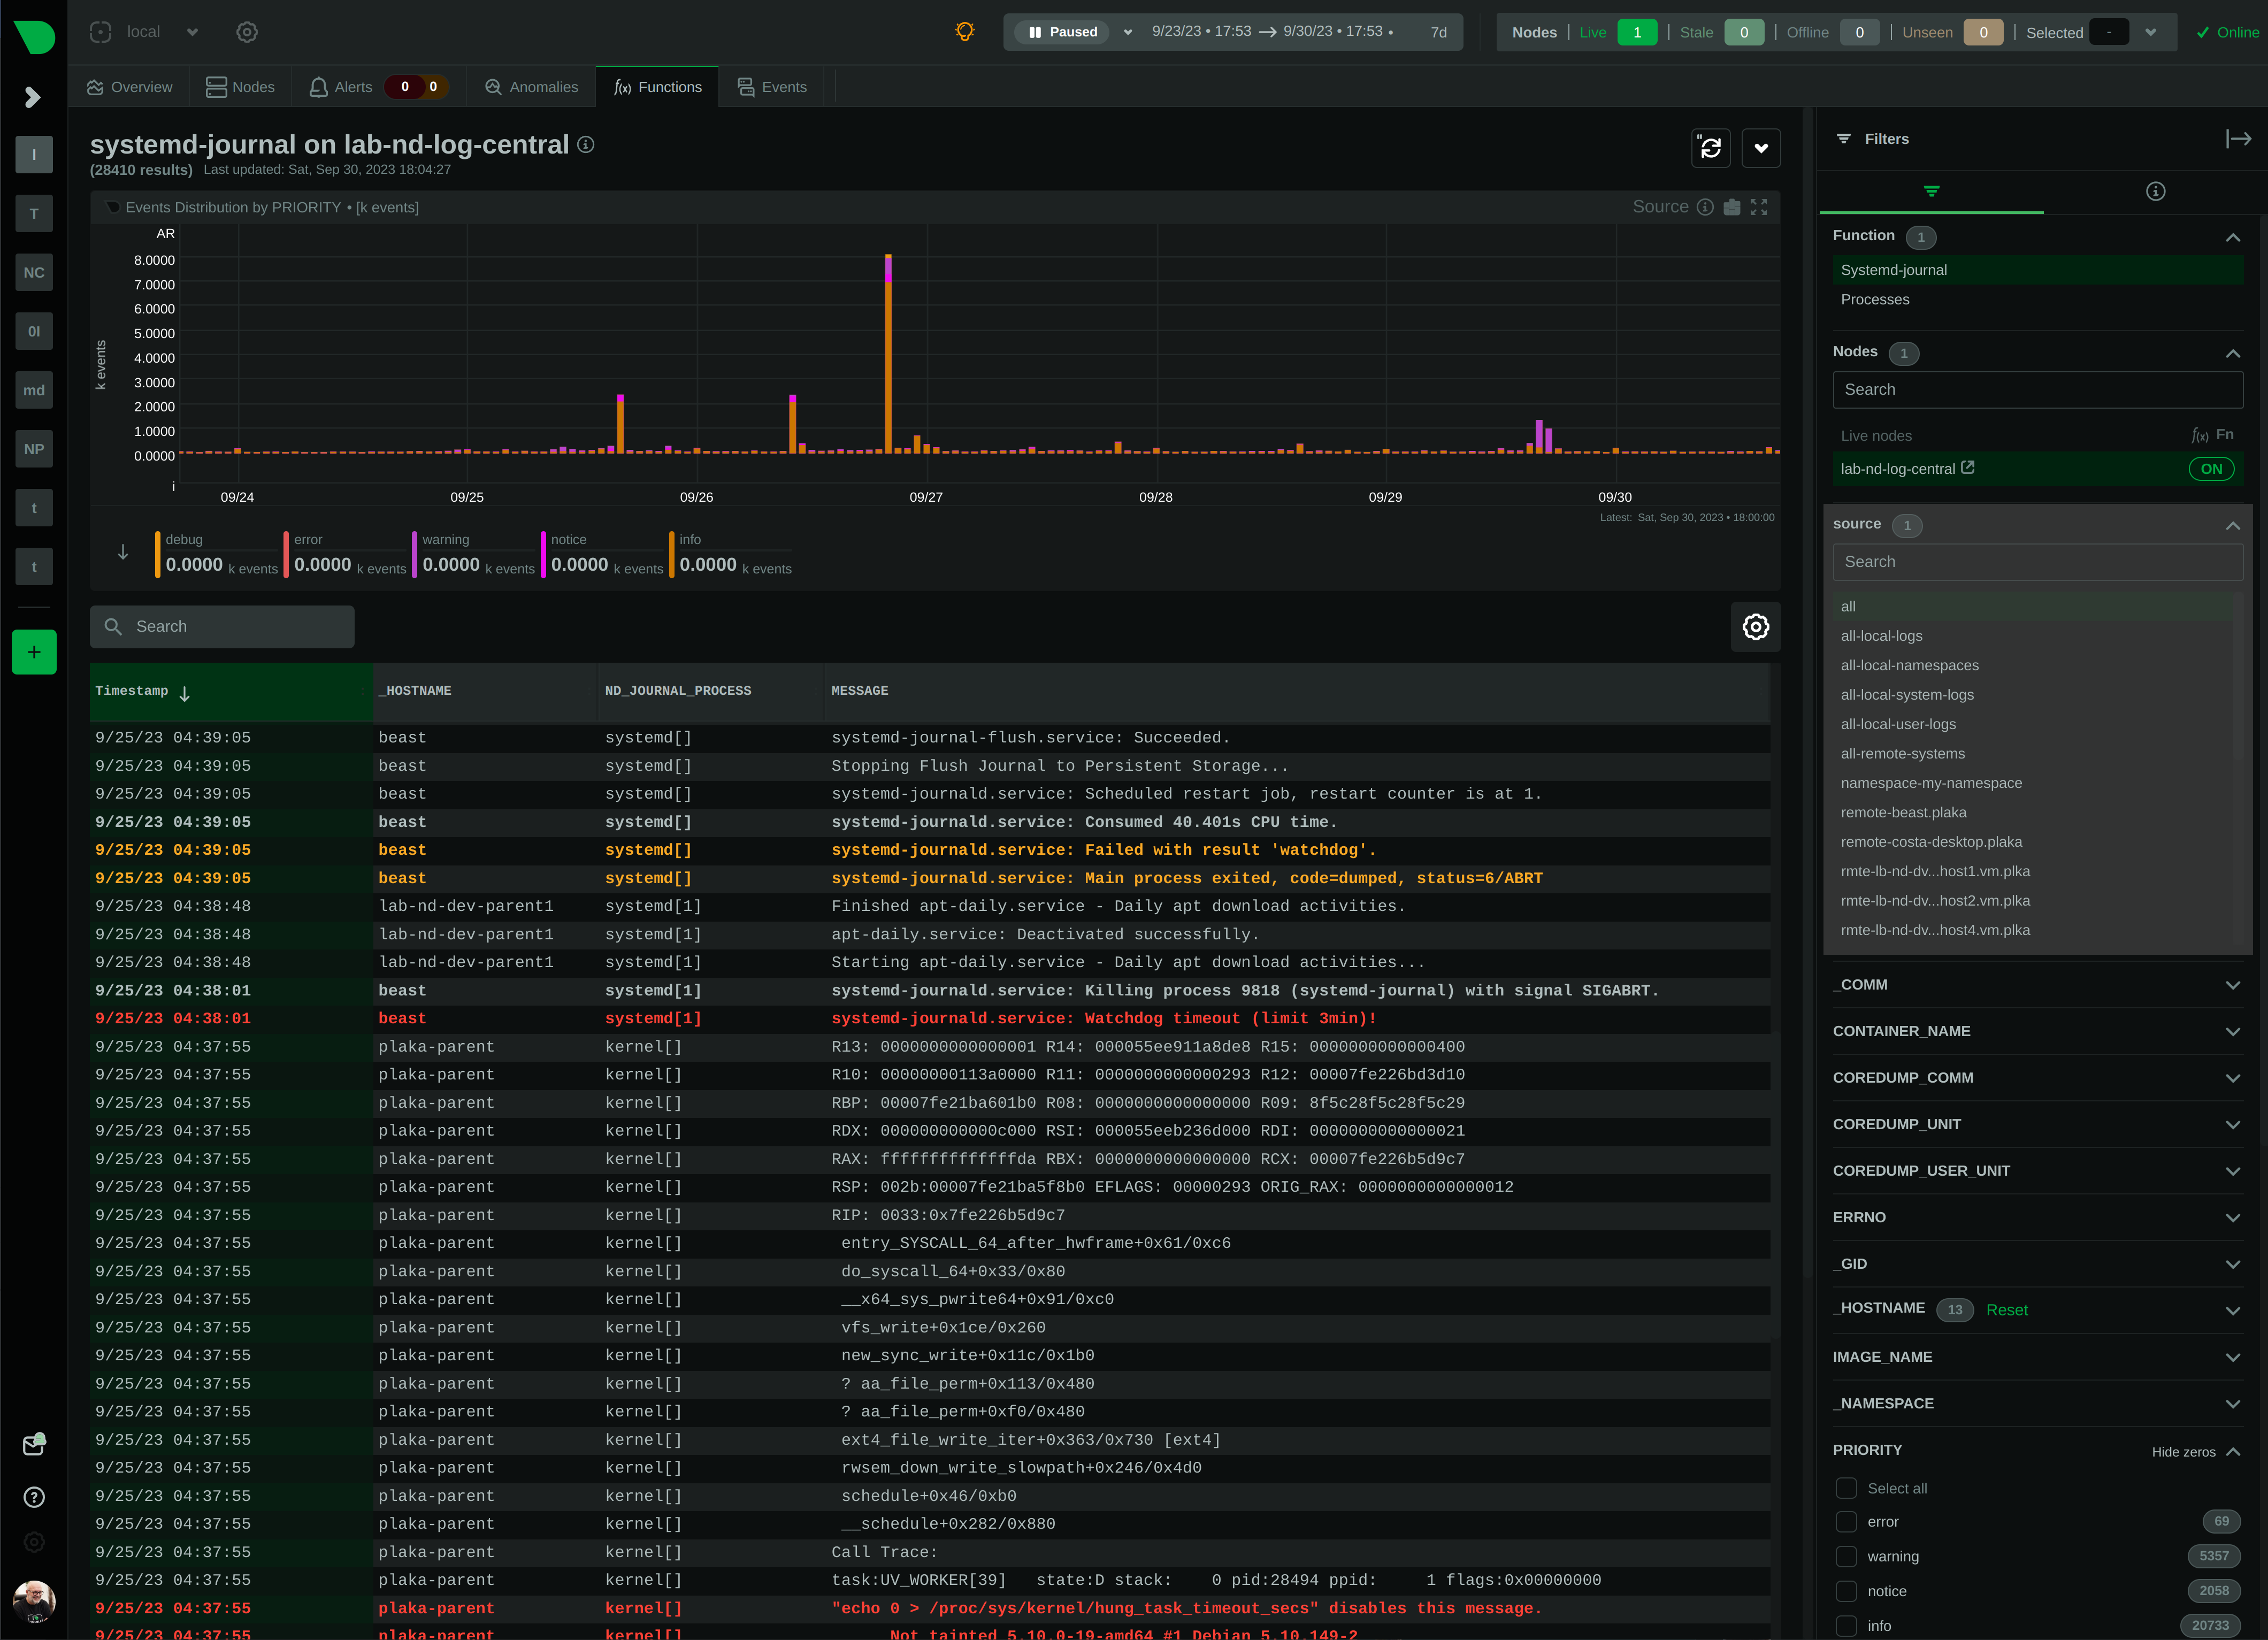 |
| 73 | |
| 74 | By default, all sources merge into a unified view of log messages. |
| 75 | |
| 76 | :::tip |
| 77 | |
| 78 | Select a specific source before analyzing logs in depth to improve query performance. |
| 79 | |
| 80 | ::: |
| 81 | |
| 82 | ### System journals |
| 83 | |
| 84 | Default journals on all `systemd`-based systems. Includes: |
| 85 | |
| 86 | - Kernel log messages (`kmsg`) |
| 87 | - Audit records |
| 88 | - Syslog messages via `systemd-journald` |
| 89 | - Output from service units |
| 90 | - Native journal API messages |
| 91 | |
| 92 | ### User journals |
| 93 | |
| 94 | - Shows journal files for all users, not just the current user |
| 95 | - Each regular user (UID > 999) typically has their own user journal |
| 96 | - Merged into `remote` journals on centralization servers |
| 97 | |
| 98 | ### Namespace journals |
| 99 | |
| 100 | - Isolate log streams per project or service |
| 101 | - Set with `LogNamespace=` in systemd unit files |
| 102 | - Requires special setup to propagate to central servers |
| 103 | |
| 104 | ### Remote journals |
| 105 | |
| 106 | - Created by `systemd-journal-remote` |
| 107 | - Typically named by sender IP, then resolved to hostname |
| 108 | |
| 109 | ## Journal fields |
| 110 | |
| 111 | `systemd` journals support dynamic fields per log entry. All fields and values are indexed for fast querying. |
| 112 | |
| 113 | Fields are enriched for readability: |
| 114 | |
| 115 | | Field | Enrichment applied | |
| 116 | |-------|-------------------| |
| 117 | | `_BOOT_ID` | Timestamp of first message for boot | |
| 118 | | `PRIORITY` | Human-readable priority name | |
| 119 | | `SYSLOG_FACILITY` | Named facility | |
| 120 | | `ERRNO` | Error name | |
| 121 | | UID and GID fields | Resolved to user and group names | |
| 122 | | `_CAP_EFFECTIVE` | Human-readable capabilities | |
| 123 | | `_SOURCE_REALTIME_TIMESTAMP` | UTC timestamp | |
| 124 | | `MESSAGE_ID` | Well-known event name if known | |
| 125 | |
| 126 | :::tip |
| 127 | |
| 128 | Enrichments are visual only and not searchable. UID/GID values are based on the system where the plugin runs. |
| 129 | |
| 130 | ::: |
| 131 | |
| 132 | ### Fields in the table |
| 133 | |
| 134 | Use the ⚙️ icon above the table to select fields to display as columns. |
| 135 | |
| 136 | 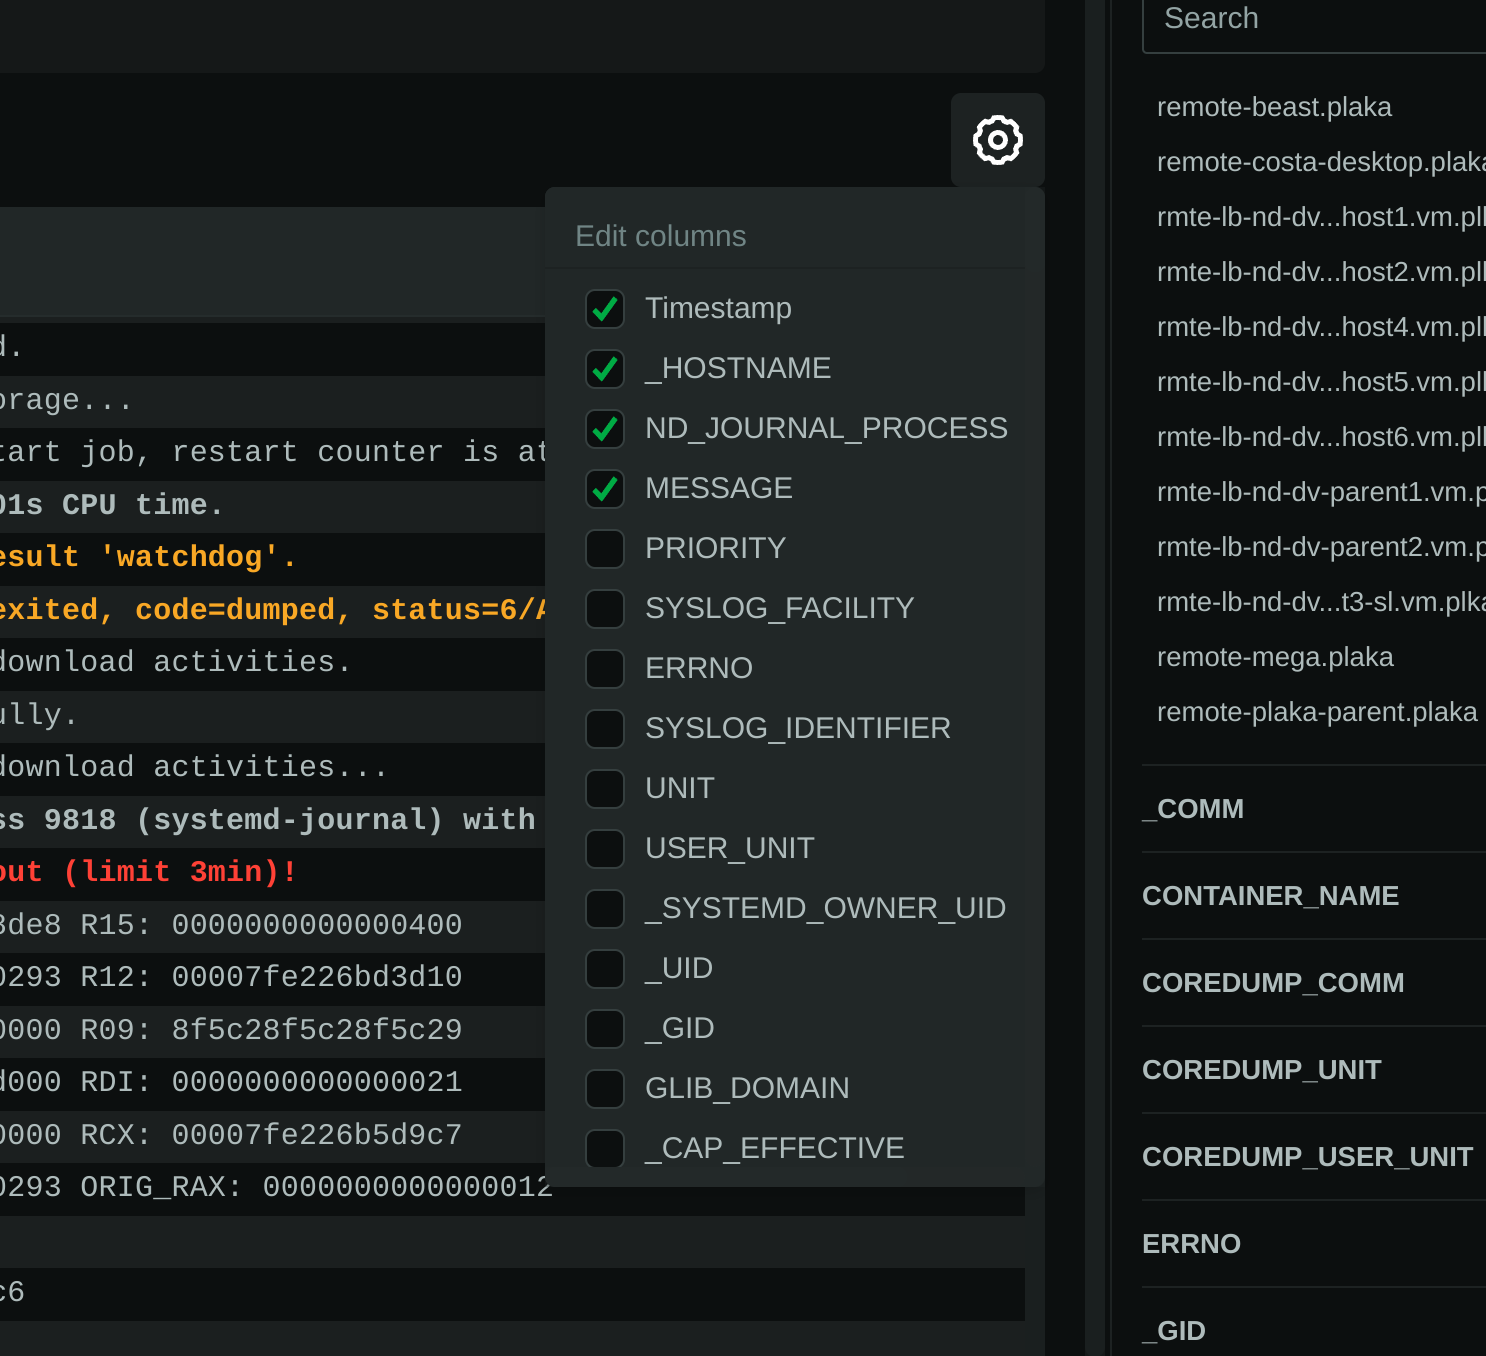 |
| 137 | |
| 138 | The table view provides a powerful way to analyze logs with: |
| 139 | - Scrollable list of log entries with customizable columns |
| 140 | - Color-coded PRIORITY levels for quick identification of issues |
| 141 | - Clickable entries for detailed viewing |
| 142 | - Time-ordered display (newest first by default) |
| 143 | - Pagination controls to navigate large datasets |
| 144 | |
| 145 | ### Fields in the sidebar |
| 146 | |
| 147 | Click a log entry to open the right-hand info panel showing all fields for that entry. |
| 148 | |
| 149 | 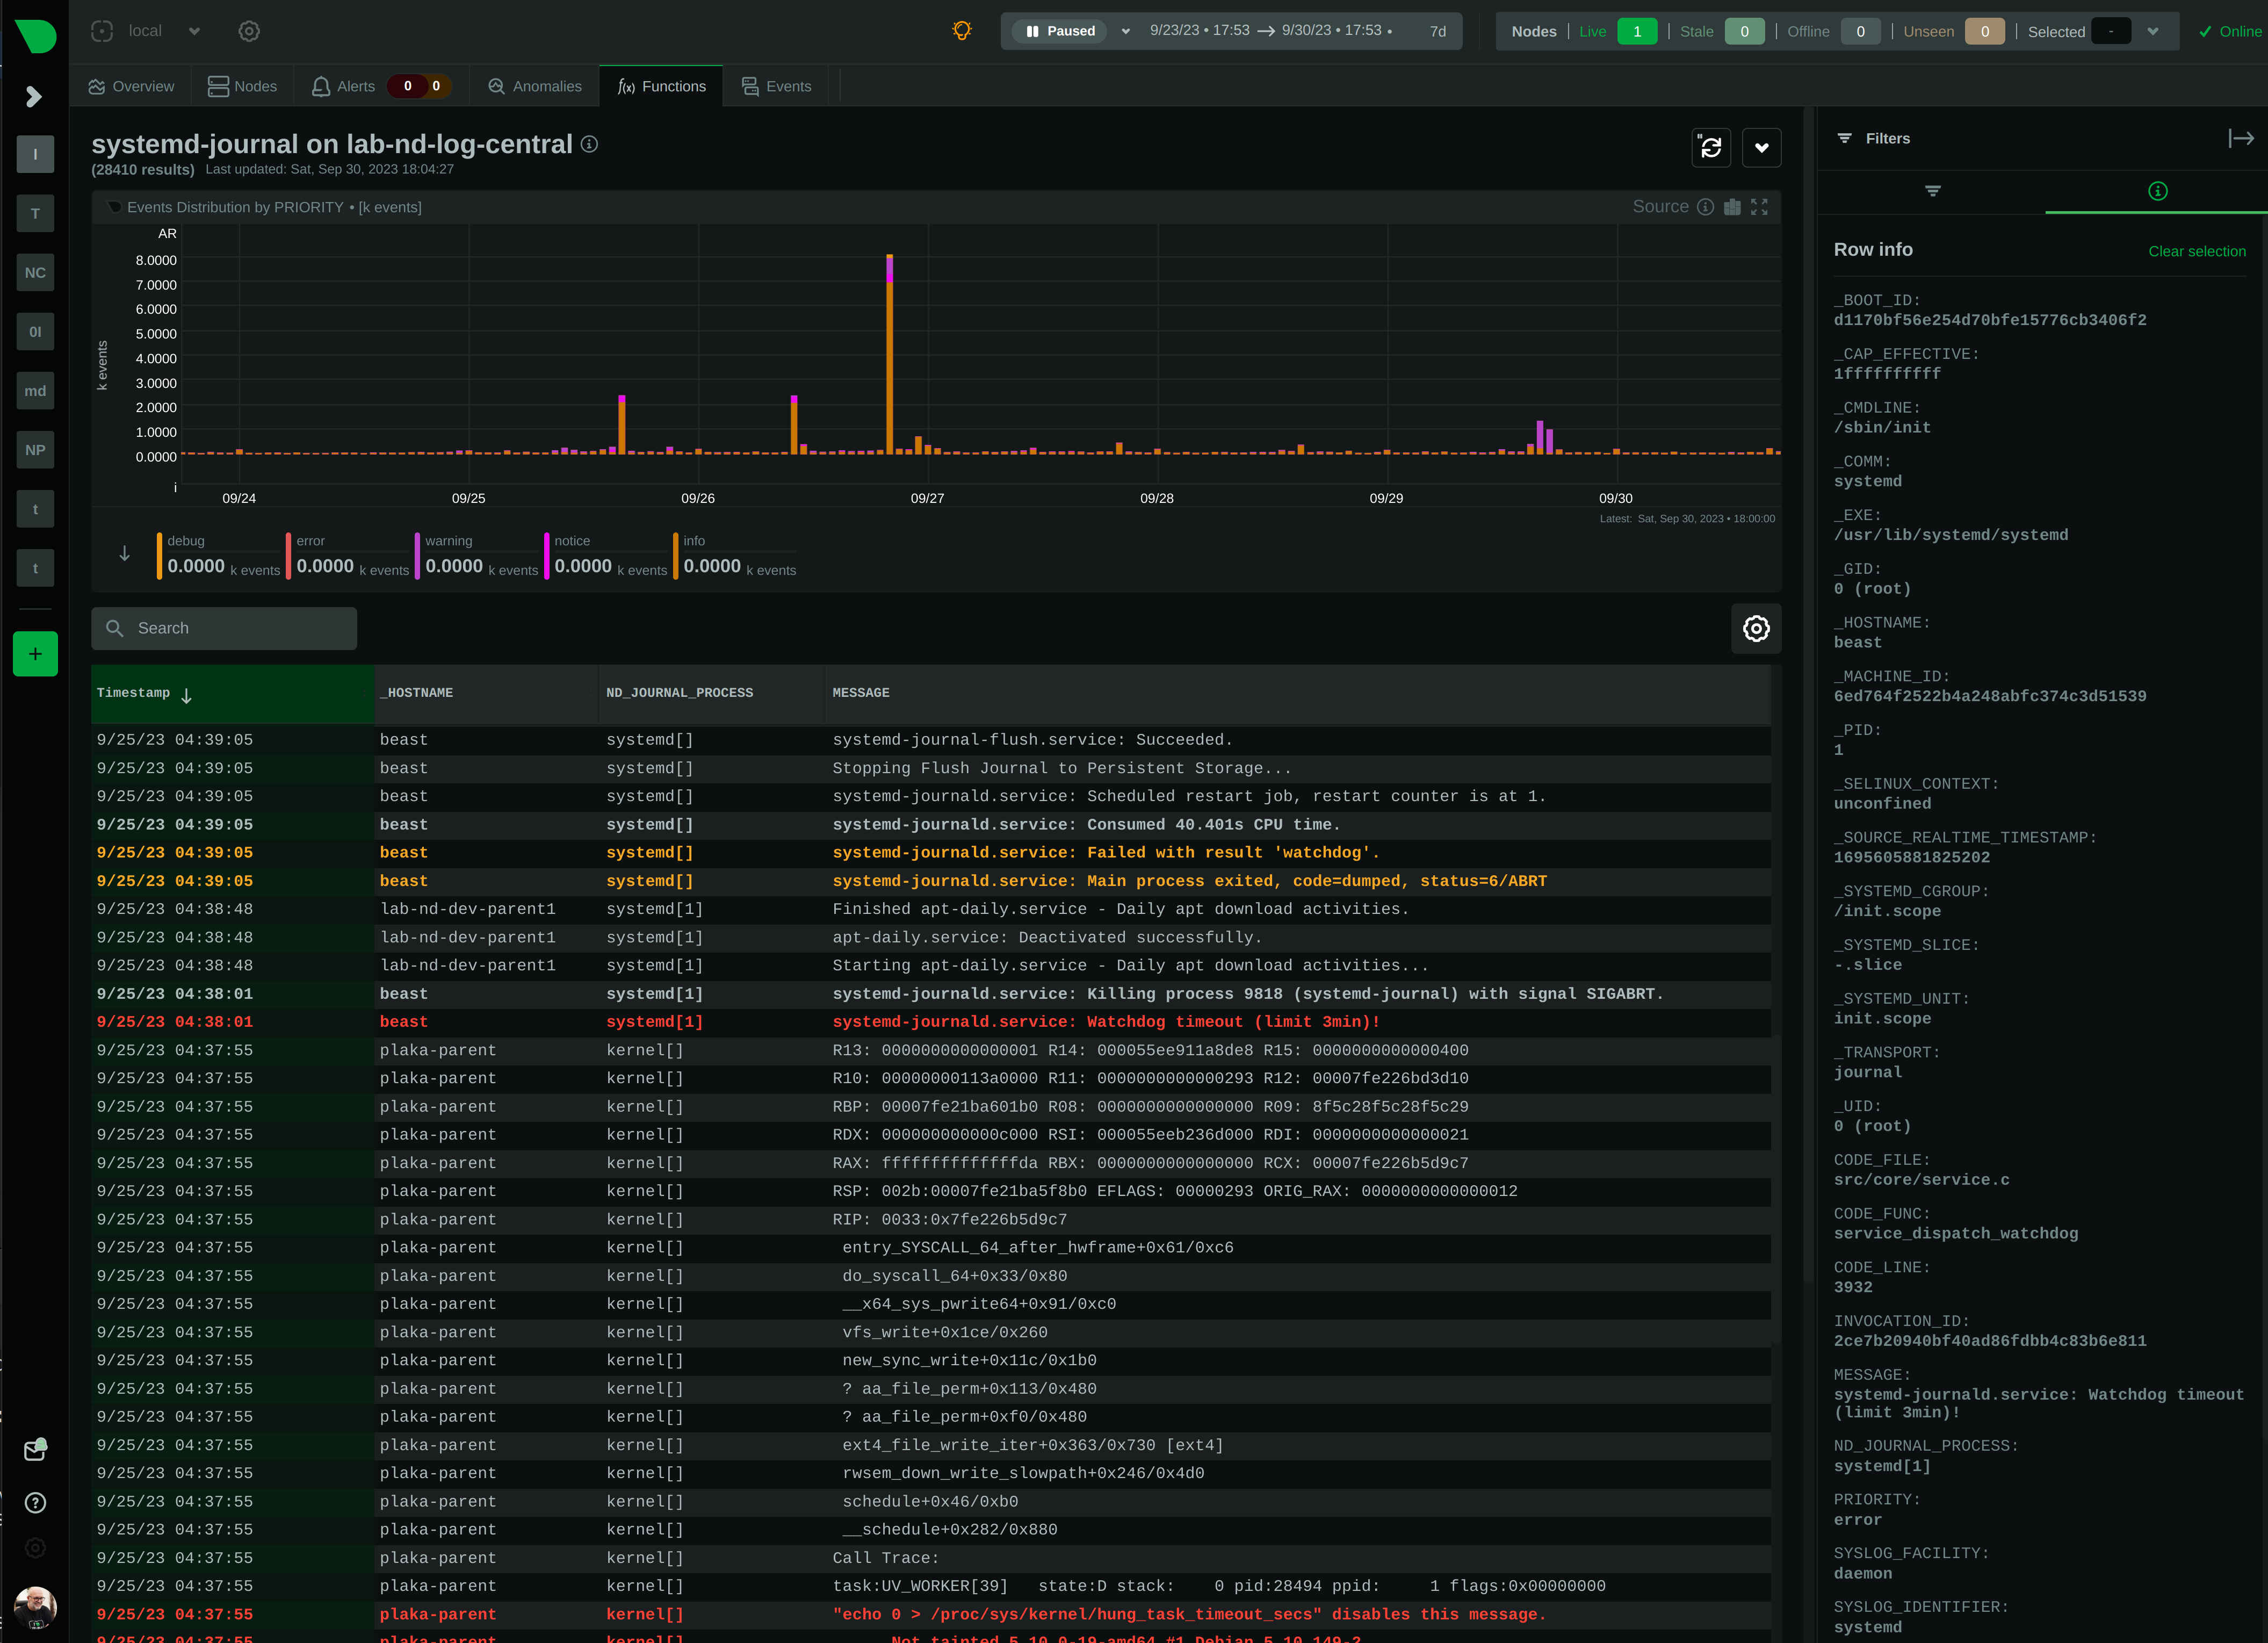 |
| 150 | |
| 151 | The sidebar shows: |
| 152 | - Every field present in the selected journal entry |
| 153 | - Raw and enriched field values |
| 154 | - Copyable text for sharing or further analysis |
| 155 | - Quick filtering options for any field value |
| 156 | |
| 157 | ### Fields as filters |
| 158 | |
| 159 | The plugin offers select fields as filters with counters. Field allowlists and blocklists protect performance. |
| 160 | |
| 161 | :::tip |
| 162 | |
| 163 | "Full data queries" mode enables negative/empty matches but may slow performance. |
| 164 | |
| 165 | ::: |
| 166 | |
| 167 | 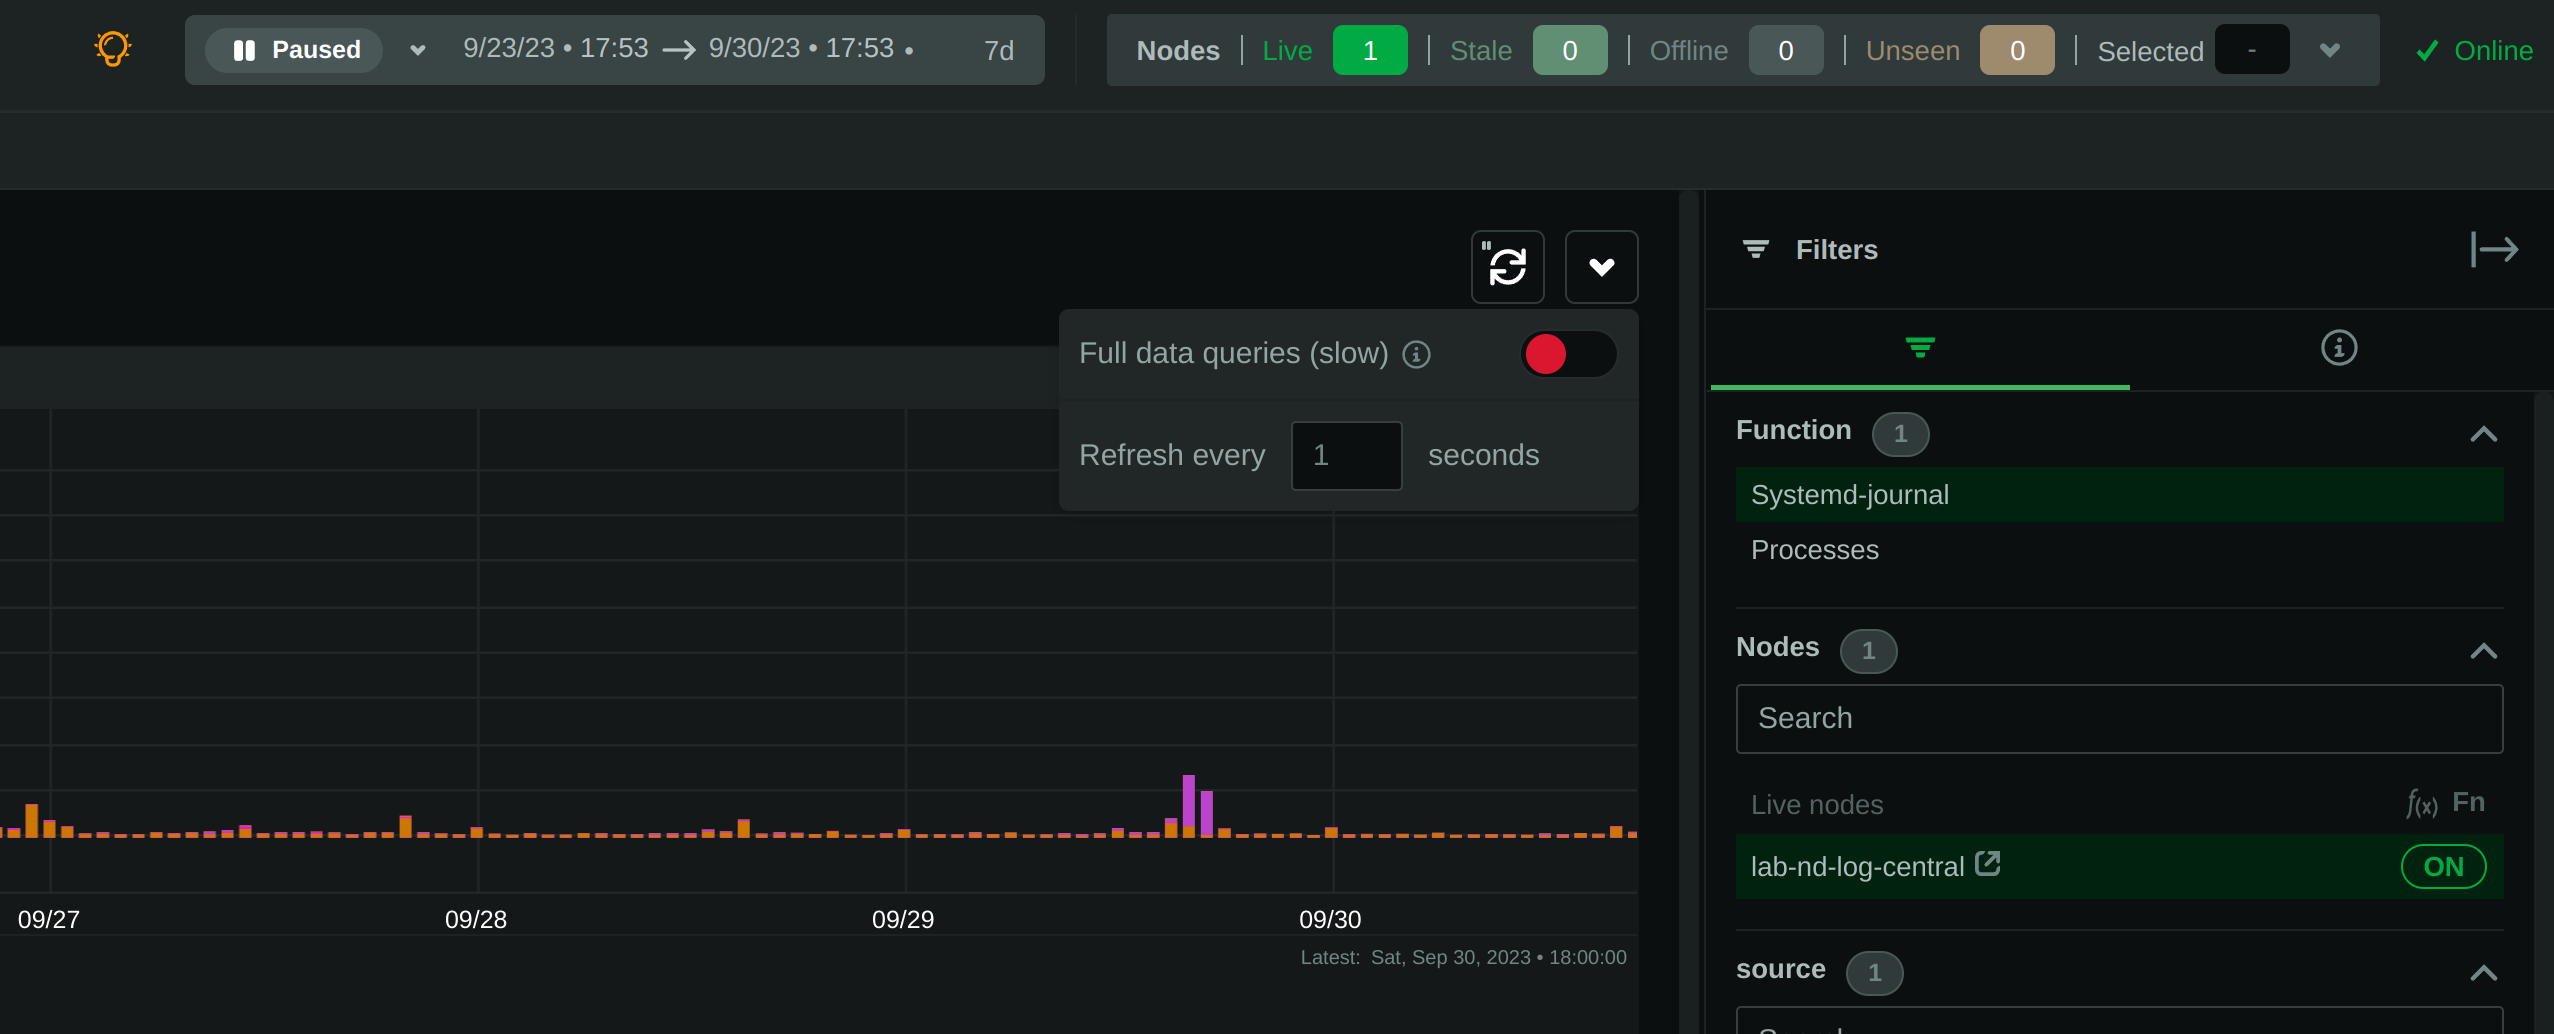 |
| 168 | |
| 169 | Key filter features: |
| 170 | - Real-time counters showing matching entry counts |
| 171 | - Multi-select capability for each field |
| 172 | - Toggleable inclusion/exclusion mode |
| 173 | - Persistent filter selections across page reloads |
| 174 | |
| 175 | ### Fields as histogram sources |
| 176 | |
| 177 | Histograms visualize log frequency per field value over time. Supports: |
| 178 | |
| 179 | - Zoom |
| 180 | - Pan |
| 181 | - Click-to-navigate |
| 182 | |
| 183 | 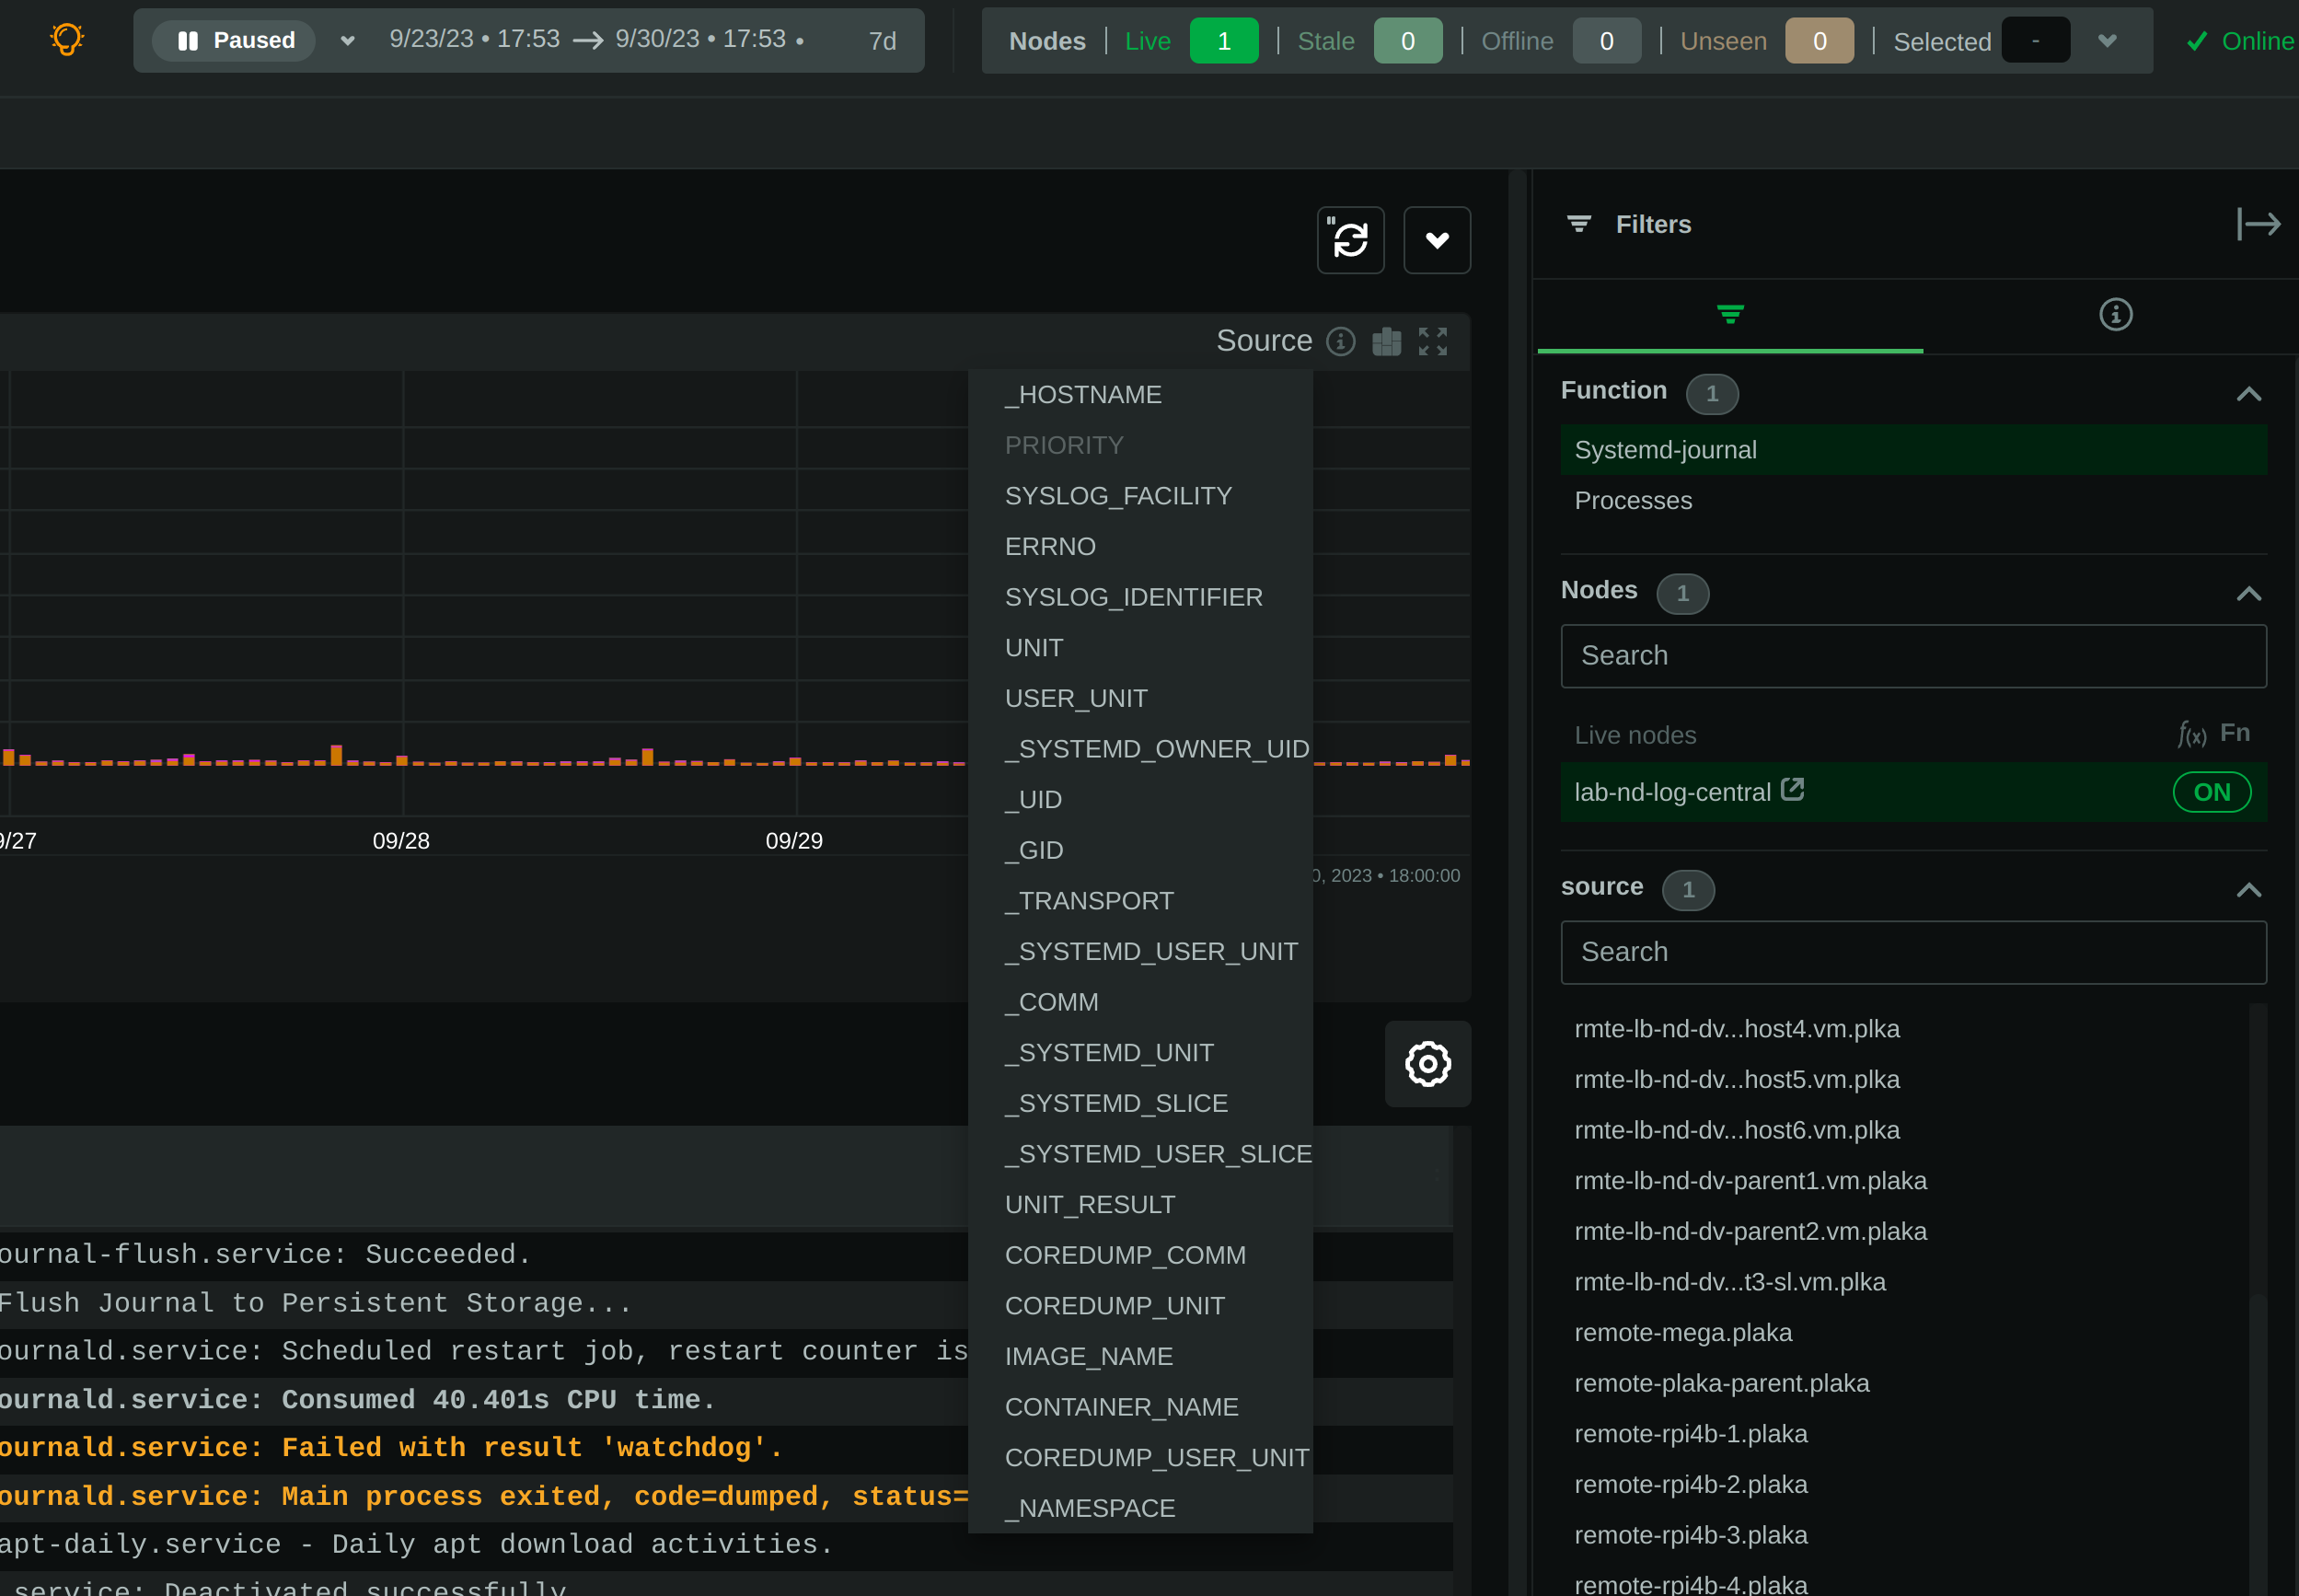 |
| 184 | |
| 185 | ## Visualization capabilities |
| 186 | |
| 187 | The plugin offers several visualization features to help you understand and navigate your logs effectively. |
| 188 | |
| 189 | ### Timeline view |
| 190 | |
| 191 | The timeline at the top of the interface shows: |
| 192 | - Log frequency distribution over time |
| 193 | - Interactive zoom and pan controls |
| 194 | - Time selection capabilities |
| 195 | - Anomaly highlighting |
| 196 | |
| 197 | ### Histograms |
| 198 | |
| 199 | Field-specific histograms provide: |
| 200 | - Visual breakdown of log entries by field value |
| 201 | - Color-coded frequency indicators |
| 202 | - Click-to-filter capability |
| 203 | - Time correlation with the main timeline |
| 204 | |
| 205 | ### Color coding |
| 206 | |
| 207 | The plugin uses color to enhance readability: |
| 208 | - Priority levels (emergency, alert, critical, etc.) have distinct colors |
| 209 | - Selected filters are highlighted |
| 210 | - Active elements use consistent color indicators |
| 211 | - Error states and warnings have clear visual differentiation |
| 212 | |
| 213 | ### UI navigation |
| 214 | |
| 215 | The interface offers several ways to navigate logs: |
| 216 | - Scroll through paginated results |
| 217 | - Jump to specific timeframes |
| 218 | - Click on histogram bars to focus on specific values |
| 219 | - Use filter panels to narrow down results |
| 220 | - Toggle between data views |
| 221 | |
| 222 | ## PLAY mode |
| 223 | |
| 224 | The plugin supports PLAY mode for real-time log streaming. Click the ▶️ button at the top of the dashboard to activate it. |
| 225 | |
| 226 | - Continuously updates the screen with newly received logs |
| 227 | - Works for both single nodes and centralized log servers |
| 228 | |
| 229 | :::tip |
| 230 | |
| 231 | **PLAY** mode offers a similar experience to `journalctl -f`, but with visual enhancements. |
| 232 | |
| 233 | ::: |
| 234 | |
| 235 | ## Full text search |
| 236 | |
| 237 | The plugin supports full-text search using flexible pattern matching: |
| 238 | |
| 239 | | Feature | Description | |
| 240 | |---------|-------------| |
| 241 | | Contains match | Default pattern style (e.g., `error` matches `error`, `error_count`) | |
| 242 | | Wildcards | `*` matches any characters (e.g., `a*b` matches `acb`, `a_long_b`) | |
| 243 | | Multiple patterns | Separate with `\|` for OR logic (e.g., `error\|warning` matches lines containing either "error" OR "warning") | |
| 244 | | Negation | Prefix with `!` to exclude (e.g., `!systemd\|*` excludes lines with `systemd`) | |
| 245 | |
| 246 | :::tip |
| 247 | |
| 248 | Full-text search applies across all fields. Combine with filters for precise results. |
| 249 | |
| 250 | ::: |
| 251 | |
| 252 | ## Query performance |
| 253 | |
| 254 | The plugin reads journal files directly using `libsystemd`, supporting concurrent readers and one writer. |
| 255 | |
| 256 | Query performance depends on several factors: |
| 257 | |
| 258 | | Factor | Impact on Performance | |
| 259 | |--------|----------------------| |
| 260 | | Number of journal files queried | Fewer files lead to faster queries | |
| 261 | | Disk speed | Faster disks improve query times | |
| 262 | | Available memory | More memory allows better caching | |
| 263 | | Filters applied | Using fewer filters speeds up the query | |
| 264 | |
| 265 | For best performance: |
| 266 | - Keep the visible **timeframe short** |
| 267 | - **Limit the number of rows** displayed |
| 268 | - **Apply filters** to reduce the dataset |
| 269 | - **Use specific sources** instead of querying across all journals |
| 270 | |
| 271 | ## Performance at scale |
| 272 | |
| 273 | The plugin handles large datasets efficiently using a sampling algorithm, ensuring responsive queries even on busy log servers. |
| 274 | |
| 275 | ### How sampling works |
| 276 | |
| 277 | | Step | Description | |
| 278 | |------|-------------| |
| 279 | | 1 | **Fully evaluates the latest 500,000 log entries** | |
| 280 | | 2 | **Distributes evaluation** across journal files for **up to 1 million entries** | |
| 281 | | 3 | **Marks additional entries** as `[unsampled]` beyond the evaluation budget | |
| 282 | | 4 | **Estimates counts** as `[estimated]` once unsampled limits are hit | |
| 283 | | 5 | Uses sequence numbers (if available) for **precise estimation** | |
| 284 | | 6 | **Continues responsive histogram generation** while managing performance | |
| 285 | |
| 286 | The plugin uses a sophisticated algorithm that prioritizes newer logs while maintaining reasonable estimates for historical data. This approach ensures that even with terabytes of journal data, the interface remains responsive and usable. |
| 287 | |
| 288 | At scale, this plugin achieves up to **25–30x faster query performance** compared to `journalctl`, especially on multi-journal queries. |
| 289 | |
| 290 | :::tip |
| 291 | |
| 292 | The sampling algorithm is designed to be resilient to large datasets. Even if you see `[unsampled]` or `[estimated]` indicators, the results remain statistically representative of the full dataset. |
| 293 | |
| 294 | ::: |
| 295 | |
| 296 | ### Accuracy implications |
| 297 | |
| 298 | Netdata's sampling budget evaluates **up to 1,000,000 log entries** before it ever marks rows as `[unsampled]`. The proportion of the dataset we examine is: |
| 299 | |
| 300 | ``` |
| 301 | evaluated_entries = min(total_entries, 1_000_000) |
| 302 | evaluated_ratio = evaluated_entries / total_entries |
| 303 | ``` |
| 304 | |
| 305 | Because the sampling set is so large, percentage breakdowns stay tight even on massive datasets. For a 10 M–entry window where 60 % of logs share a value, the 95 % confidence interval around that percentage is: |
| 306 | |
| 307 | ``` |
| 308 | standard_error ≈ sqrt(p * (1 - p) / evaluated_entries) |
| 309 | CI95 ≈ 1.96 * standard_error = 1.96 * sqrt(0.6 * 0.4 / 1_000_000) ≈ ±0.9 % |
| 310 | ``` |
| 311 | |
| 312 | By contrast, evaluating only 5,000 entries (a small-sample approach typical of many log explorers when speed is prioritized) would yield: |
| 313 | |
| 314 | ``` |
| 315 | CI95 ≈ 1.96 * sqrt(0.6 * 0.4 / 5_000) ≈ ±8.7 % |
| 316 | ``` |
| 317 | |
| 318 | The result is that even at extreme scale, mainly because Netdata samples 200x more data, it can provide significantly more accurate estimations on value distributions, at comparable performance. |
| 319 | |
| 320 | ## Best practices for better performance |
| 321 | |
| 322 | `systemd-journal` is designed for **reliability first** and **performance second**. It uses deduplication, field linking, and compression to minimize disk footprint, but the structure of journal files can still result in higher disk I/O during queries. |
| 323 | |
| 324 | ### Filesystem and storage recommendations |
| 325 | |
| 326 | | Recommendation | Benefit | |
| 327 | |---------------|---------| |
| 328 | | Use compressed filesystems (`ext4`, `btrfs`, `zfs`) | Reduces disk I/O by minimizing file size | |
| 329 | | Use SSD or NVMe storage | Speeds up journal file reads | |
| 330 | | Avoid small fragmented journal files | Prevents query slowdowns on busy centralization servers | |
| 331 | |
| 332 | ### Memory and caching |
| 333 | |
| 334 | | Recommendation | Benefit | |
| 335 | |---------------|---------| |
| 336 | | Allocate more RAM for the system | Improves OS caching of journal files | |
| 337 | | Query the same timeframe repeatedly | Benefits from cached journal data | |
| 338 | | Limit query timeframes on large datasets | Reduces memory overhead and improves speed | |
| 339 | |
| 340 | :::tip |
| 341 | |
| 342 | Journal data is cached by the operating system. The more RAM available for caching, the faster your queries will be. |
| 343 | |
| 344 | ::: |
| 345 | |
| 346 | ### Query strategies |
| 347 | |
| 348 | | Strategy | Why it helps | |
| 349 | |----------|-------------| |
| 350 | | Narrow the timeframe of your queries | Minimizes data scanned per request | |
| 351 | | Use specific filters and source selections | Limits the scope of journal files being queried | |
| 352 | | Limit the number of rows returned in the UI | Keeps response times fast and manageable | |
| 353 | | Enable PLAY mode only when necessary | Reduces continuous query load on the system | |
| 354 | |
| 355 | ## Configuration and maintenance |
| 356 | |
| 357 | The Netdata `systemd` journal plugin is designed to work **out of the box** with minimal configuration. |
| 358 | |
| 359 | ### Requirements |
| 360 | |
| 361 | | Requirement | Description | |
| 362 | |------------|-------------| |
| 363 | | Netdata Agent | Installed on the node or centralization server | |
| 364 | | Journal files | Located in `/var/log/journal` (persistent) or `/run/log/journal` (volatile) | |
| 365 | | Netdata Cloud account | Required to access Netdata Functions, including this plugin | |
| 366 | |
| 367 | :::tip |
| 368 | |
| 369 | No additional configuration is required for this plugin to operate on supported systems. |
| 370 | |
| 371 | ::: |
| 372 | |
| 373 | ### Maintenance considerations |
| 374 | |
| 375 | | Task | Purpose | |
| 376 | |------|---------| |
| 377 | | **Keep Netdata up to date** | Ensures plugin compatibility and performance optimizations | |
| 378 | | **Monitor disk usage** of journal files | Prevents performance issues caused by excessive log volume | |
| 379 | | **Verify** journal file **locations** | Confirms the plugin can access the intended sources | |
| 380 | | **Review** source selections **periodically** | Adjusts scope as infrastructure changes | |
| 381 | |
| 382 | ## FAQ |
| 383 | |
| 384 | <details> |
| 385 | <summary><strong>Can I use this plugin on journal centralization servers?</strong></summary> |
| 386 | |
| 387 | Yes — you can centralize your logs using `systemd-journal-remote` and install Netdata on the centralization server to explore logs from your entire infrastructure. |
| 388 | The plugin provides **multi-node views** and allows you to combine logs from multiple servers. |
| 389 | |
| 390 | :::tip |
| 391 | |
| 392 | For details on configuring a journal centralization server, see the [journal centralization setup guide](/docs/observability-centralization-points/logs-centralization-points-with-systemd-journald/passive-journal-centralization-without-encryption.md). |
| 393 | |
| 394 | ::: |
| 395 | |
| 396 | </details> |
| 397 | |
| 398 | <details> |
| 399 | <summary><strong>Can I use this plugin from a parent Netdata node?</strong></summary> |
| 400 | |
| 401 | Yes — if your nodes are connected to a Netdata parent, all their functions are accessible via the parent's UI. |
| 402 | This includes access to the `systemd` journal plugin for each child node. |
| 403 | |
| 404 | </details> |
| 405 | |
| 406 | <details> |
| 407 | <summary><strong>Does this plugin expose any data to Netdata Cloud?</strong></summary> |
| 408 | |
| 409 | No — when accessing the Agent directly, **no data is exposed to Netdata Cloud**. |
| 410 | The Cloud account is only used for authentication. Data flows directly from your Netdata Agent to your web browser. |
| 411 | |
| 412 | :::tip |
| 413 | |
| 414 | When using `https://app.netdata.cloud`, communication is encrypted but data is not stored in Netdata Cloud. |
| 415 | See [this discussion](https://github.com/netdata/netdata/discussions/16136) for more details. |
| 416 | |
| 417 | ::: |
| 418 | |
| 419 | </details> |
| 420 | |
| 421 | <details> |
| 422 | <summary><strong>What are `volatile` and `persistent` journals?</strong></summary> |
| 423 | |
| 424 | - **Persistent journals** are stored on disk in `/var/log/journal` |
| 425 | - **Volatile journals** are kept in memory in `/run/log/journal` and cleared on reboot |
| 426 | |
| 427 | :::tip |
| 428 | |
| 429 | For more, check `man systemd-journald`. |
| 430 | |
| 431 | ::: |
| 432 | |
| 433 | </details> |
| 434 | |
| 435 | <details> |
| 436 | <summary><strong>I centralize my logs with Loki. Why use Netdata for journals?</strong></summary> |
| 437 | |
| 438 | `systemd` journals support **dynamic, high-cardinality labels** with all fields indexed by default. |
| 439 | When sending logs to Loki, you must predefine which fields to include, reducing flexibility. |
| 440 | |
| 441 | Netdata reads journals directly, providing: |
| 442 | |
| 443 | | Feature | Netdata journal plugin | Loki | |
| 444 | |---------|----------------------|------| |
| 445 | | **Indexed on all fields** | ✔️ Yes | ❌ Only selected labels | |
| 446 | | Supports **dynamic fields** | ✔️ Yes | ❌ Assumes fixed schema | |
| 447 | | Requires **configuration** | ❌ No | ✔️ Yes (relabel rules, label selection) | |
| 448 | |
| 449 | :::tip |
| 450 | |
| 451 | Loki and `systemd` journals serve different use cases — they can complement, not replace, each other. |
| 452 | |
| 453 | ::: |
| 454 | |
| 455 | </details> |
| 456 | |
| 457 | <details> |
| 458 | <summary><strong>Is it worth setting up a `systemd` logs centralization server?</strong></summary> |
| 459 | |
| 460 | Yes — the tools required are included in modern Linux systems, and setup is straightforward. |
| 461 | Centralized logs provide high visibility with minimal overhead. |
| 462 | |
| 463 | </details> |
| 464 | |
| 465 | <details> |
| 466 | <summary><strong>How do I configure a journal centralization server?</strong></summary> |
| 467 | |
| 468 | Two main strategies: |
| 469 | |
| 470 | | Strategy | Description | |
| 471 | |----------|------------| |
| 472 | | **Active sources** | Central server **fetches logs** from each node | |
| 473 | | **Passive sources** | Nodes **push logs** to the central server | |
| 474 | |
| 475 | :::tip |
| 476 | |
| 477 | See the [passive journal centralization without encryption guide](/docs/observability-centralization-points/logs-centralization-points-with-systemd-journald/passive-journal-centralization-without-encryption.md) |
| 478 | or the [encrypted setup guide](https://github.com/netdata/netdata/blob/master/docs/observability-centralization-points/logs-centralization-points-with-systemd-journald). |
| 479 | |
| 480 | ::: |
| 481 | |
| 482 | </details> |
| 483 | |
| 484 | <details> |
| 485 | <summary><strong>What are the limitations when using centralization?</strong></summary> |
| 486 | |
| 487 | | Limitation | Notes | |
| 488 | |------------|-------| |
| 489 | | Namespaces not supported by Docker | [Related issue](https://github.com/moby/moby/issues/41879) | |
| 490 | | `systemd-journal-upload` does not handle namespaces automatically | Requires manual configuration per namespace | |
| 491 | |
| 492 | </details> |
| 493 | |
| 494 | <details> |
| 495 | <summary><strong>How can I report bugs or request features?</strong></summary> |
| 496 | |
| 497 | If you encounter issues or have ideas for improvements: |
| 498 | |
| 499 | 1. Check the [existing GitHub issues](https://github.com/netdata/netdata/issues) |
| 500 | 2. Submit a new issue with detailed reproduction steps |
| 501 | 3. For feature requests, describe your use case clearly |
| 502 | |
| 503 | The plugin is actively maintained, and feedback helps improve it for everyone. |
| 504 | |
| 505 | </details> |
| 506 | |
| 507 | <details> |
| 508 | <summary><strong>Can I customize the plugin's appearance or behavior?</strong></summary> |
| 509 | |
| 510 | Currently, customization options are limited to: |
| 511 | - Column selection in the table view |
| 512 | - Filter configurations |
| 513 | - Time range selection |
| 514 | - Source selection |
| 515 | |
| 516 | Additional customization features may be added in future releases based on user feedback. |
| 517 | |
| 518 | </details> |
| 519 | |
| 520 | ## How to troubleshoot common issues |
| 521 | |
| 522 | Use the following solutions to resolve common issues with the systemd journal plugin. |
| 523 | |
| 524 | ### How to resolve plugin availability problems |
| 525 | |
| 526 | | Possible Cause | Solution | |
| 527 | |---------------|----------| |
| 528 | | Running an older Netdata version (pre-1.44) | Update Netdata to version **1.44 or later** | |
| 529 | | Using Alpine-based Docker container | Use the **Debian-based Netdata container** (from 1.44+) | |
| 530 | | Using a static build of Netdata (`/opt/netdata`) | Switch to a package-based installation or source build | |
| 531 | | Missing `libsystemd` or required dependencies | Make sure `libsystemd` is installed on the host | |
| 532 | |
| 533 | ### How to fix slow or timing out queries |
| 534 | |
| 535 | | Possible Cause | Solution | |
| 536 | |---------------|----------| |
| 537 | | Querying too many journal files at once | Select specific **sources** before running your query | |
| 538 | | Long timeframes selected | Narrow the **timeframe** to improve performance | |
| 539 | | Low disk speed or insufficient RAM | Use faster disks and increase memory for better caching | |
| 540 | | Too many active filters | Reduce the number of **filters** applied | |
| 541 | |
| 542 | :::tip |
| 543 | |
| 544 | Sampling ensures responsiveness at scale, but selecting sources and filters remains the best way to optimize performance. |
| 545 | |
| 546 | ::: |
| 547 | |
| 548 | ### How to solve missing journal sources |
| 549 | |
| 550 | | Possible Cause | Solution | |
| 551 | |---------------|----------| |
| 552 | | Journals stored outside default paths | Create a **symlink** to `/var/log/journal` or `/run/log/journal` | |
| 553 | | Journals not persistent across reboots | Configure `systemd-journald` to enable **persistent logs** with `Storage=persistent` in `/etc/systemd/journald.conf` | |
| 554 | |
| 555 | ### How to address missing or incomplete logs |
| 556 | |
| 557 | | Possible Cause | Solution | |
| 558 | |---------------|----------| |
| 559 | | Journals rotated or deleted | Ensure **persistent storage** is enabled | |
| 560 | | Misconfigured journal centralization | Check `systemd-journal-remote` and `systemd-journal-upload` settings | |
| 561 | | Namespace logs not forwarded | Manually configure forwarding for **each namespace** | |
| 562 | |
| 563 | ### How to fix UI rendering issues |
| 564 | |
| 565 | | Possible Cause | Solution | |
| 566 | |---------------|----------| |
| 567 | | Outdated browser | Update to the latest version of Chrome, Firefox, Safari, or Edge | |
| 568 | | Zoom level affecting layout | Reset browser zoom to 100% | |
| 569 | | Ad blockers or script blockers | Temporarily disable to test if they're interfering | |
| 570 | | Network connectivity issues | Check network connections to Netdata server | |
| 571 | |
| 572 | ### How to understand error messages |
| 573 | |
| 574 | | Error Message | Meaning | Solution | |
| 575 | |--------------|---------|----------| |
| 576 | | "Plugin not available" | The systemd-journal plugin isn't loaded | Check your Netdata installation type (must not be Alpine or static) | |
| 577 | | "Unable to open journal" | Permission issues accessing journal files | Ensure Netdata has proper permissions for journal directories | |
| 578 | | "Timeout while querying" | Query is taking too long to complete | Reduce the query scope with filters or shorter timeframes | |
| 579 | | "No sources detected" | Cannot find valid journal files | Check journal file locations and setup | |
| 580 | | "Source selection failed" | Selected source cannot be accessed | Verify the source exists and permissions are correct | |
| 581 | |
| 582 | ## How to verify setup |
| 583 | |
| 584 | ### How to check if the plugin is running |
| 585 | |
| 586 | ```bash |
| 587 | sudo netdata -W plugins |
| 588 | ``` |
| 589 | |
| 590 | Check that the `systemd-journal` plugin is listed as active. |
| 591 | |
| 592 | ### How to confirm journal sources are detected |
| 593 | |
| 594 | 1. Open the **Logs** tab in the Netdata UI |
| 595 | 2. Use the **Sources** filter on the right sidebar |
| 596 | 3. Ensure you can see your expected sources (e.g., `system`, `user`, `remote`, or specific namespaces) |
| 597 | |
| 598 | :::tip |
| 599 | |
| 600 | If sources are missing, check the journal file locations and verify symlinks if needed. |
| 601 | |
| 602 | ::: |
| 603 | |
| 604 | ### How to test basic queries |
| 605 | |
| 606 | - Apply a **simple filter** (like `PRIORITY=3`) and confirm logs are returned |
| 607 | - Use **full-text search** (e.g., search for `error`) and verify results populate correctly |
| 608 | - Toggle **PLAY mode** to confirm live logs are streaming |
| 609 | |
| 610 | ### How to validate plugin logs |
| 611 | |
| 612 | Check the Netdata Agent logs for plugin startup messages: |
| 613 | |
| 614 | ```bash |
| 615 | sudo journalctl -u netdata | grep journal |
| 616 | ``` |
| 617 | |
| 618 | Look for lines confirming the journal plugin started successfully and detected sources. |