| 1 | <!-- |
| 2 | title: Monitor any process in real-time with Netdata |
| 3 | sidebar_label: Monitor any process in real-time with Netdata |
| 4 | description: "Tap into Netdata's powerful collectors, with per-second utilization metrics for every process, to troubleshoot faster and make data-informed decisions." |
| 5 | image: /img/seo/guides/monitor/process.png |
| 6 | custom_edit_url: https://github.com/netdata/netdata/edit/master/docs/guides/monitor/process.md |
| 7 | learn_status: "Published" |
| 8 | learn_rel_path: "Operations" |
| 9 | --> |
| 10 | |
| 11 | # Monitor any process in real-time with Netdata |
| 12 | |
| 13 | Netdata is more than a multitude of generic system-level metrics and visualizations. Instead of providing only a bird's |
| 14 | eye view of your system, leaving you to wonder exactly _what_ is taking up 99% CPU, Netdata also gives you visibility |
| 15 | into _every layer_ of your node. These additional layers give you context, and meaningful insights, into the true health |
| 16 | and performance of your infrastructure. |
| 17 | |
| 18 | One of these layers is the _process_. Every time a Linux system runs a program, it creates an independent process that |
| 19 | executes the program's instructions in parallel with anything else happening on the system. Linux systems track the |
| 20 | state and resource utilization of processes using the [`/proc` filesystem](https://en.wikipedia.org/wiki/Procfs), and |
| 21 | Netdata is designed to hook into those metrics to create meaningful visualizations out of the box. |
| 22 | |
| 23 | While there are a lot of existing command-line tools for tracking processes on Linux systems, such as `ps` or `top`, |
| 24 | only Netdata provides dozens of real-time charts, at both per-second and event frequency, without you having to write |
| 25 | SQL queries or know a bunch of arbitrary command-line flags. |
| 26 | |
| 27 | With Netdata's process monitoring, you can: |
| 28 | |
| 29 | - Benchmark/optimize performance of standard applications, like web servers or databases |
| 30 | - Benchmark/optimize performance of custom applications |
| 31 | - Troubleshoot CPU/memory/disk utilization issues (why is my system's CPU spiking right now?) |
| 32 | - Perform granular capacity planning based on the specific needs of your infrastructure |
| 33 | - Search for leaking file descriptors |
| 34 | - Investigate zombie processes |
| 35 | |
| 36 | ... and much more. Let's get started. |
| 37 | |
| 38 | ## Prerequisites |
| 39 | |
| 40 | - One or more Linux nodes running [Netdata](/packaging/installer/README.md) |
| 41 | - A general understanding of how |
| 42 | to [configure the Netdata Agent](/docs/netdata-agent/configuration/README.md) |
| 43 | using `edit-config`. |
| 44 | - A Netdata Cloud account. [Sign up](https://app.netdata.cloud) if you don't have one already. |
| 45 | |
| 46 | ## How does Netdata do process monitoring? |
| 47 | |
| 48 | The Netdata Agent already knows to look for hundreds |
| 49 | of [standard applications that we support via collectors](/src/collectors/COLLECTORS.md), |
| 50 | and groups them based on their |
| 51 | purpose. Let's say you want to monitor a MySQL |
| 52 | database using its process. The Netdata Agent already knows to look for processes with the string `mysqld` in their |
| 53 | name, along with a few others, and puts them into the `sql` group. This `sql` group then becomes a dimension in all |
| 54 | process-specific charts. |
| 55 | |
| 56 | The process and groups settings are used by two unique and powerful collectors. |
| 57 | |
| 58 | [**`apps.plugin`**](/src/collectors/apps.plugin/README.md) looks at the Linux |
| 59 | process tree every second, much like `top` or |
| 60 | `ps fax`, and collects resource utilization information on every running process. It then automatically adds a layer of |
| 61 | meaningful visualization on top of these metrics, and creates per-process/application charts. |
| 62 | |
| 63 | [**`ebpf.plugin`**](/src/collectors/ebpf.plugin/README.md): Netdata's extended |
| 64 | Berkeley Packet Filter (eBPF) collector |
| 65 | monitors Linux kernel-level metrics for file descriptors, virtual filesystem IO, and process management, and then hands |
| 66 | process-specific metrics over to `apps.plugin` for visualization. The eBPF collector also collects and visualizes |
| 67 | metrics on an _event frequency_, which means it captures every kernel interaction, and not just the volume of |
| 68 | interaction at every second in time. That's even more precise than Netdata's standard per-second granularity. |
| 69 | |
| 70 | ### Per-process metrics and charts in Netdata |
| 71 | |
| 72 | With these collectors working in parallel, Netdata visualizes the following per-second metrics for _any_ process on your |
| 73 | Linux systems: |
| 74 | |
| 75 | - CPU utilization (`apps.cpu`) |
| 76 | - Total CPU usage |
| 77 | - User/system CPU usage (`apps.cpu_user`/`apps.cpu_system`) |
| 78 | - Disk I/O |
| 79 | - Physical reads/writes (`apps.preads`/`apps.pwrites`) |
| 80 | - Logical reads/writes (`apps.lreads`/`apps.lwrites`) |
| 81 | - Open unique files (if a file is found open multiple times, it is counted just once, `apps.files`) |
| 82 | - Memory |
| 83 | - Real Memory Used (non-shared, `apps.mem`) |
| 84 | - Virtual Memory Allocated (`apps.vmem`) |
| 85 | - Minor page faults (i.e. memory activity, `apps.minor_faults`) |
| 86 | - Processes |
| 87 | - Threads running (`apps.threads`) |
| 88 | - Processes running (`apps.processes`) |
| 89 | - Carried over uptime (since the last Netdata Agent restart, `apps.uptime`) |
| 90 | - Minimum uptime (`apps.uptime_min`) |
| 91 | - Average uptime (`apps.uptime_average`) |
| 92 | - Maximum uptime (`apps.uptime_max`) |
| 93 | - Pipes open (`apps.pipes`) |
| 94 | - Swap memory |
| 95 | - Swap memory used (`apps.swap`) |
| 96 | - Major page faults (i.e. swap activity, `apps.major_faults`) |
| 97 | - Network |
| 98 | - Sockets open (`apps.sockets`) |
| 99 | - eBPF file |
| 100 | - Number of calls to open files. (`apps.file_open`) |
| 101 | - Number of files closed. (`apps.file_closed`) |
| 102 | - Number of calls to open files that returned errors. |
| 103 | - Number of calls to close files that returned errors. |
| 104 | - eBPF syscall |
| 105 | - Number of calls to delete files. (`apps.file_deleted`) |
| 106 | - Number of calls to `vfs_write`. (`apps.vfs_write_call`) |
| 107 | - Number of calls to `vfs_read`. (`apps.vfs_read_call`) |
| 108 | - Number of bytes written with `vfs_write`. (`apps.vfs_write_bytes`) |
| 109 | - Number of bytes read with `vfs_read`. (`apps.vfs_read_bytes`) |
| 110 | - Number of calls to write a file that returned errors. |
| 111 | - Number of calls to read a file that returned errors. |
| 112 | - eBPF process |
| 113 | - Number of process created with `do_fork`. (`apps.process_create`) |
| 114 | - Number of threads created with `do_fork` or `__x86_64_sys_clone`, depending on your system's kernel |
| 115 | version. (`apps.thread_create`) |
| 116 | - Number of times that a process called `do_exit`. (`apps.task_close`) |
| 117 | - eBPF net |
| 118 | - Number of bytes sent. (`apps.bandwidth_sent`) |
| 119 | - Number of bytes received. (`apps.bandwidth_recv`) |
| 120 | |
| 121 | As an example, here's the per-process CPU utilization chart, including a `sql` group/dimension. |
| 122 | |
| 123 | 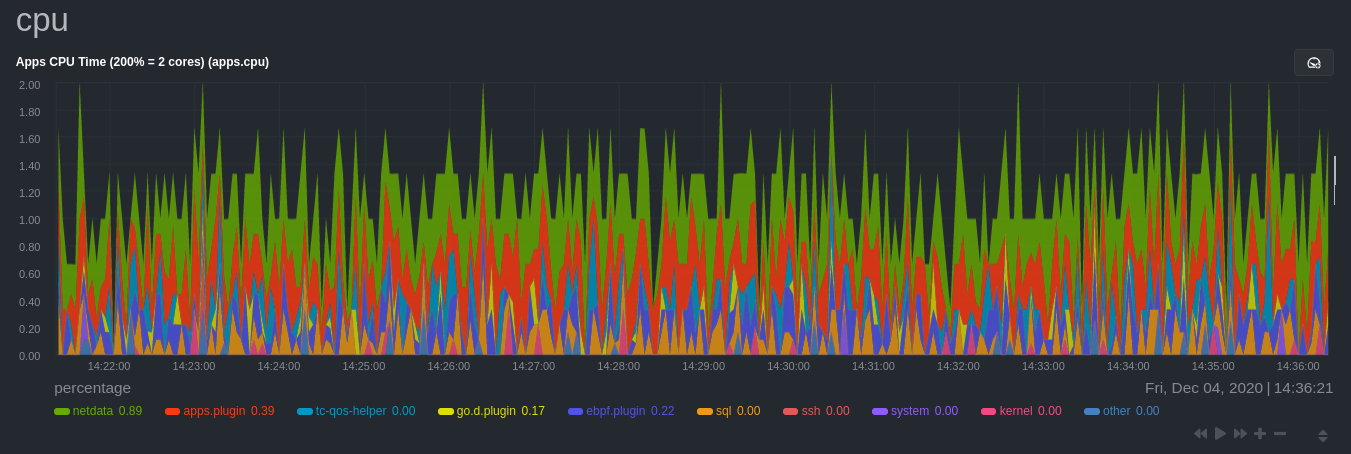 |
| 124 | |
| 125 | ## Configure the Netdata Agent to recognize a specific process |
| 126 | |
| 127 | To monitor any process, you need to make sure the Netdata Agent is aware of it. As mentioned above, the Agent is already |
| 128 | aware of hundreds of processes, and collects metrics from them automatically. |
| 129 | |
| 130 | But, if you want to change the grouping behavior, add an application that isn't yet supported in the Netdata Agent, or |
| 131 | monitor a custom application, you need to edit the `apps_groups.conf` configuration file. |
| 132 | |
| 133 | Navigate to your [Netdata config directory](/docs/netdata-agent/configuration/README.md) and |
| 134 | use `edit-config` to edit the file. |
| 135 | |
| 136 | ```bash |
| 137 | cd /etc/netdata # Replace this with your Netdata config directory if not at /etc/netdata. |
| 138 | sudo ./edit-config apps_groups.conf |
| 139 | ``` |
| 140 | |
| 141 | Inside the file are lists of process names, oftentimes using wildcards (`*`), that the Netdata Agent looks for and |
| 142 | groups together. For example, the Netdata Agent looks for processes starting with `mysqld`, `mariad`, `postgres`, and |
| 143 | others, and groups them into `sql`. That makes sense, since all these processes are for SQL databases. |
| 144 | |
| 145 | ```text |
| 146 | sql: mysqld* mariad* postgres* postmaster* oracle_* ora_* sqlservr |
| 147 | ``` |
| 148 | |
| 149 | These groups are then reflected as [dimensions](/src/web/README.md#dimensions) |
| 150 | within Netdata's charts. |
| 151 | |
| 152 | 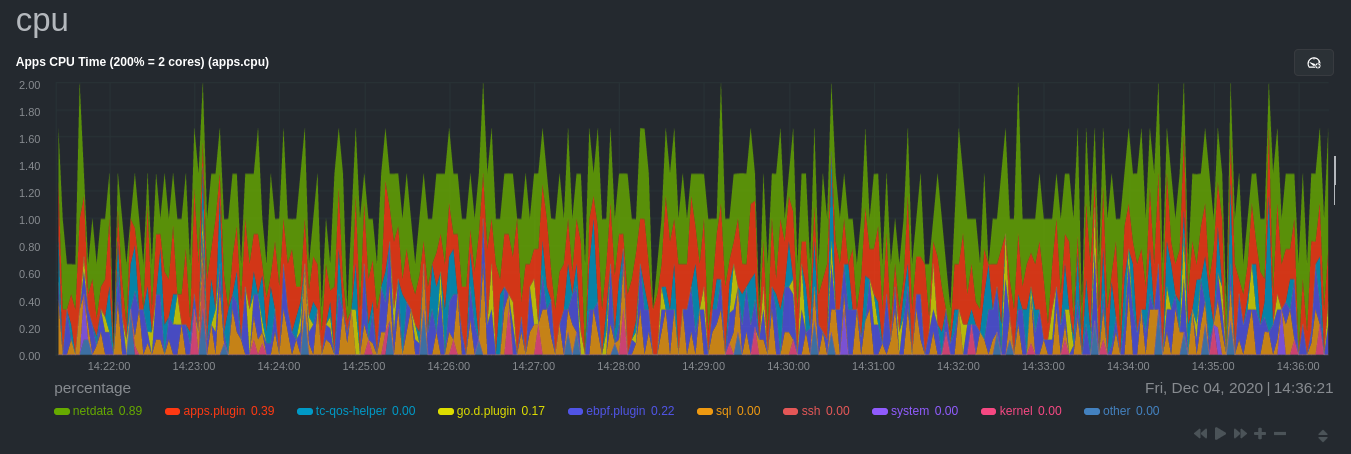 |
| 154 | |
| 155 | See the following two sections for details based on your needs. If you don't need to configure `apps_groups.conf`, jump |
| 156 | down to [visualizing process metrics](#visualize-process-metrics). |
| 157 | |
| 158 | ### Standard applications (web servers, databases, containers, and more) |
| 159 | |
| 160 | As explained above, the Netdata Agent is already aware of most standard applications you run on Linux nodes, and you |
| 161 | shouldn't need to configure it to discover them. |
| 162 | |
| 163 | However, if you're using multiple applications that the Netdata Agent groups together you may want to separate them for |
| 164 | more precise monitoring. If you're not running any other types of SQL databases on that node, you don't need to change |
| 165 | the grouping, since you know that any MySQL is the only process contributing to the `sql` group. |
| 166 | |
| 167 | Let's say you're using both MySQL and PostgreSQL databases on a single node, and want to monitor their processes |
| 168 | independently. Open the `apps_groups.conf` file as explained in |
| 169 | the [section above](#configure-the-netdata-agent-to-recognize-a-specific-process) and scroll down until you find |
| 170 | the `database servers` section. Create new groups for MySQL and PostgreSQL, and move their process queries into the |
| 171 | unique groups. |
| 172 | |
| 173 | ```text |
| 174 | # ----------------------------------------------------------------------------- |
| 175 | # database servers |
| 176 | |
| 177 | mysql: mysqld* |
| 178 | postgres: postgres* |
| 179 | sql: mariad* postmaster* oracle_* ora_* sqlservr |
| 180 | ``` |
| 181 | |
| 182 | Restart Netdata with `sudo systemctl restart netdata`, or |
| 183 | the appropriate method for your system, to start collecting utilization metrics |
| 184 | from your application. Time to [visualize your process metrics](#visualize-process-metrics). |
| 185 | |
| 186 | ### Custom applications |
| 187 | |
| 188 | Let's assume you have an application that runs on the process `custom-app`. To monitor eBPF metrics for that application |
| 189 | separate from any others, you need to create a new group in `apps_groups.conf` and associate that process name with it. |
| 190 | |
| 191 | Open the `apps_groups.conf` file as explained in |
| 192 | the [section above](#configure-the-netdata-agent-to-recognize-a-specific-process). Scroll down |
| 193 | to `# NETDATA processes accounting`. |
| 194 | Above that, paste in the following text, which creates a new `custom-app` group with the `custom-app` process. Replace |
| 195 | `custom-app` with the name of your application's Linux process. `apps_groups.conf` should now look like this: |
| 196 | |
| 197 | ```text |
| 198 | ... |
| 199 | # ----------------------------------------------------------------------------- |
| 200 | # Custom applications to monitor with apps.plugin and ebpf.plugin |
| 201 | |
| 202 | custom-app: custom-app |
| 203 | |
| 204 | # ----------------------------------------------------------------------------- |
| 205 | # NETDATA processes accounting |
| 206 | ... |
| 207 | ``` |
| 208 | |
| 209 | Restart Netdata with `sudo systemctl restart netdata`, or |
| 210 | the appropriate method for your system, to start collecting utilization metrics |
| 211 | from your application. |
| 212 | |
| 213 | ## Visualize process metrics |
| 214 | |
| 215 | Now that you're collecting metrics for your process, you'll want to visualize them using Netdata's real-time, |
| 216 | interactive charts. Find these visualizations in the same section regardless of whether you |
| 217 | use [Netdata Cloud](https://app.netdata.cloud) for infrastructure monitoring, or single-node monitoring with the local |
| 218 | Agent's dashboard at `http://localhost:19999`. |
| 219 | |
| 220 | If you need a refresher on all the available per-process charts, see |
| 221 | the [above list](#per-process-metrics-and-charts-in-netdata). |
| 222 | |
| 223 | ### Using Netdata's application collector (`apps.plugin`) |
| 224 | |
| 225 | `apps.plugin` puts all of its charts under the **Applications** section of any Netdata dashboard. |
| 226 | |
| 227 | 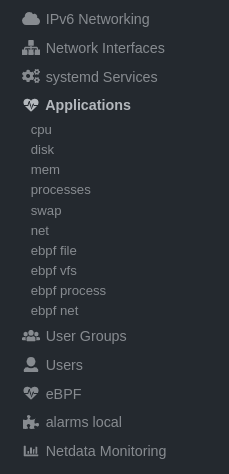 |
| 228 | |
| 229 | Let's continue with the MySQL example. We can create a [test |
| 230 | database](https://www.digitalocean.com/community/tutorials/how-to-measure-mysql-query-performance-with-mysqlslap) in |
| 231 | MySQL to generate load on the `mysql` process. |
| 232 | |
| 233 | `apps.plugin` immediately collects and visualizes this activity `apps.cpu` chart, which shows an increase in CPU |
| 234 | utilization from the `sql` group. There is a parallel increase in `apps.pwrites`, which visualizes writes to disk. |
| 235 | |
| 236 | 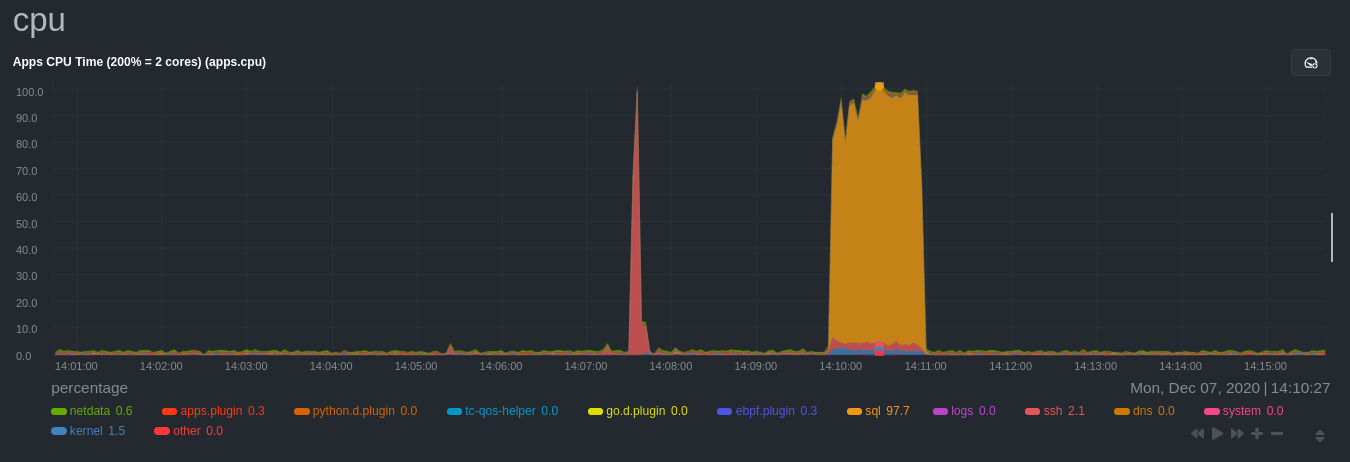 |
| 237 | |
| 238 | 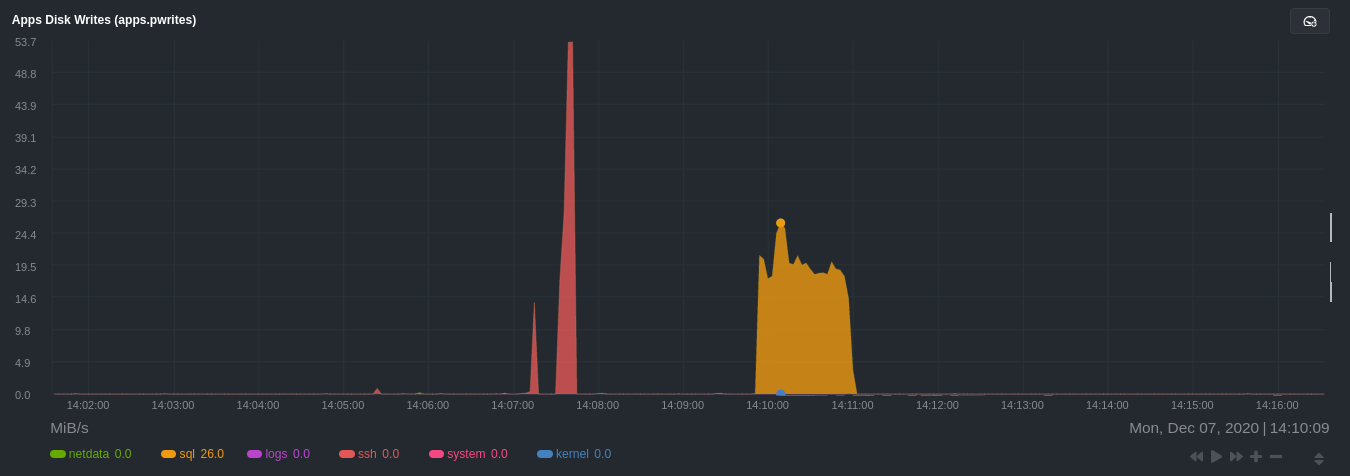 |
| 239 | |
| 240 | Next, the `mysqlslap` utility queries the database to provide some benchmarking load on the MySQL database. It won't |
| 241 | look exactly like a production database executing lots of user queries, but it gives you an idea into the possibility of |
| 242 | these visualizations. |
| 243 | |
| 244 | ```bash |
| 245 | sudo mysqlslap --user=sysadmin --password --host=localhost --concurrency=50 --iterations=10 --create-schema=employees --query="SELECT * FROM dept_emp;" --verbose |
| 246 | ``` |
| 247 | |
| 248 | The following per-process disk utilization charts show spikes under the `sql` group at the same time `mysqlslap` was run |
| 249 | numerous times, with slightly different concurrency and query options. |
| 250 | |
| 251 | 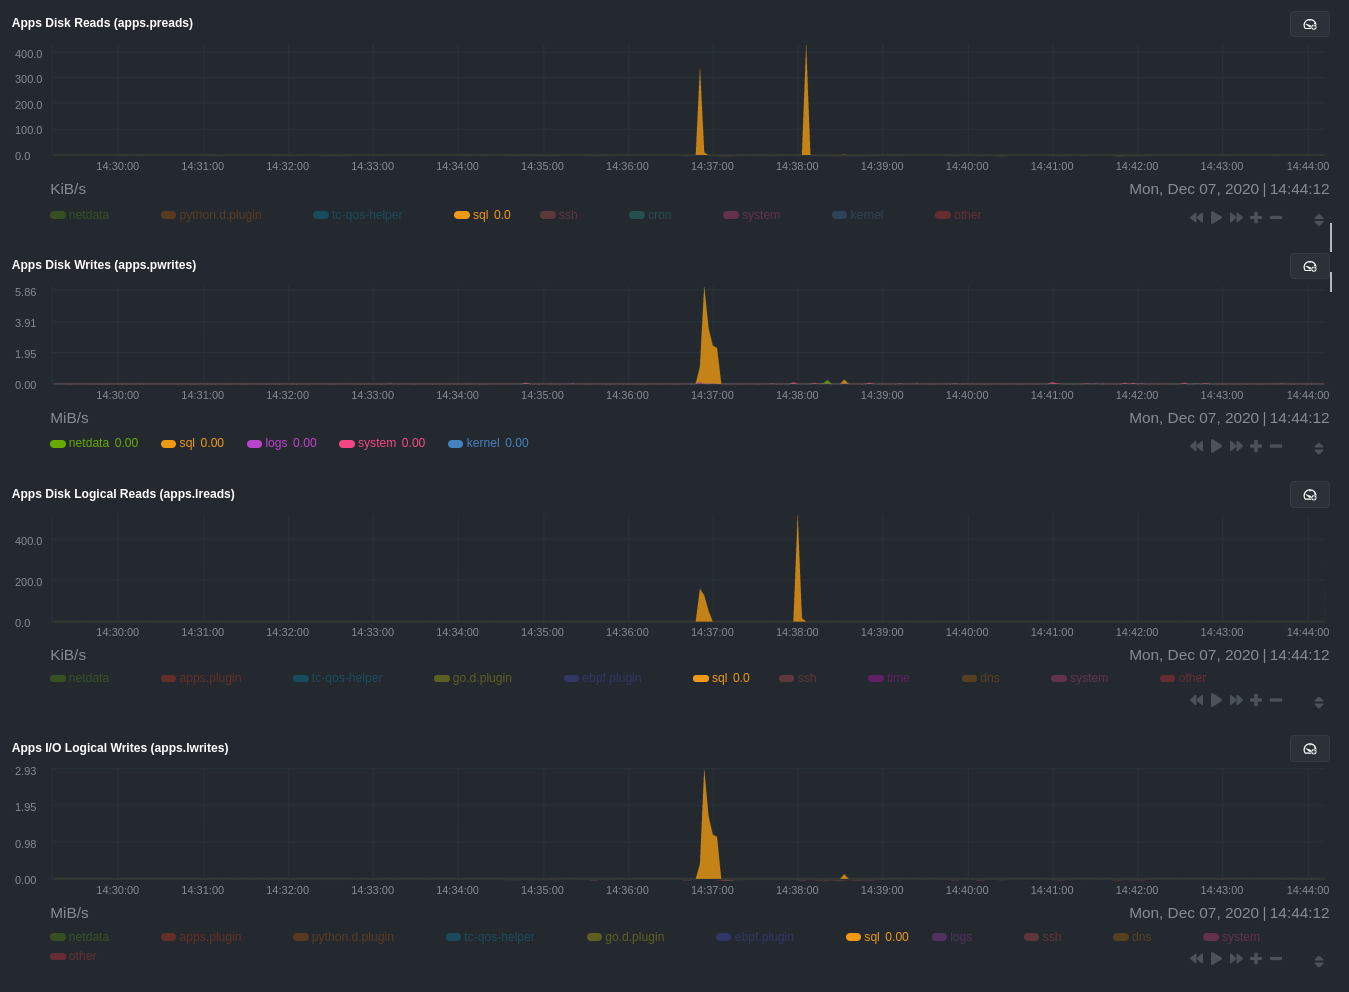 |
| 252 | |
| 253 | > 💡 Click on any dimension below a chart in Netdata Cloud (or to the right of a chart on a local Agent dashboard), to |
| 254 | > visualize only that dimension. This can be particularly useful in process monitoring to separate one process' |
| 255 | > utilization from the rest of the system. |
| 256 | |
| 257 | ### Using Netdata's eBPF collector (`ebpf.plugin`) |
| 258 | |
| 259 | Netdata's eBPF collector puts its charts in two places. Of most importance to process monitoring are the **ebpf file**, |
| 260 | **ebpf syscall**, **ebpf process**, and **ebpf net** sub-sections under **Applications**, shown in the above screenshot. |
| 261 | |
| 262 | For example, running the above workload shows the entire "story" how MySQL interacts with the Linux kernel to open |
| 263 | processes/threads to handle a large number of SQL queries, then subsequently close the tasks as each query returns the |
| 264 | relevant data. |
| 265 | |
| 266 | 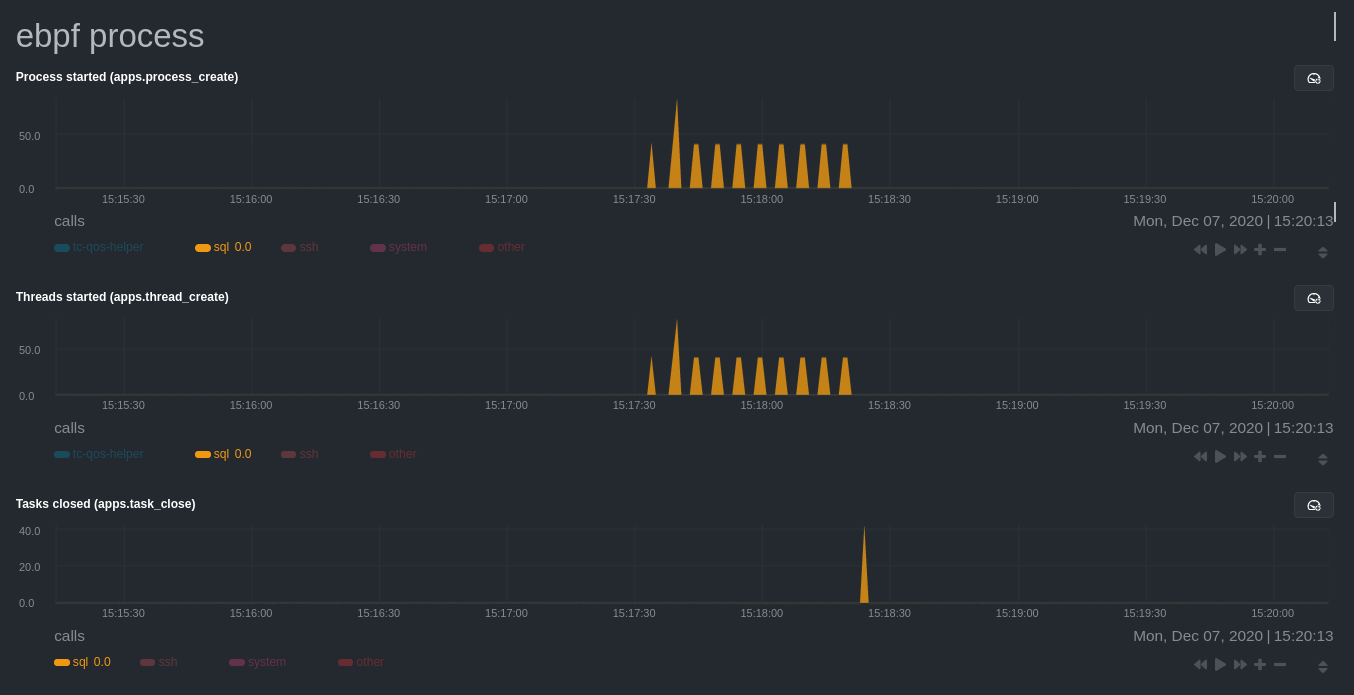 |
| 267 | |
| 268 | `ebpf.plugin` visualizes additional eBPF metrics, which are system-wide and not per-process, under the **eBPF** section. |
| 269 | |
| 270 |