StatsD Collector
What is StatsD?
StatsD is a system for collecting metrics from applications. Your applications send metrics to StatsD, usually via non-blocking UDP communication, and StatsD servers collect these metrics, perform simple calculations, and push them to time-series databases.
Learn more about the StatsD protocol.
Overview
| Feature | Description |
|---|---|
| Metric Collection | Collect real-time metrics from any application supporting StatsD protocol |
| Visualization | View metrics as private charts (one per metric) or custom synthetic charts |
| Supported Metric Types | Gauges, Counters, Meters, Timers, Histograms, Sets, Dictionaries |
| Transport | Both UDP (low-overhead) and TCP (reliable, higher volume) supported |
| Performance | Can collect millions of metrics per second using just 1 CPU core |
| Integration | Built directly into Netdata - no extra installation needed |
| Language Support | Use with Python, Node.js, Java, Go, Ruby, Shell scripts, and more |
:::tip
Want a hands-on example? Jump to the K6 StatsD Walkthrough
:::
Supported Metric Types Summary
| Metric Type | Purpose | Format | LLM Summary |
|---|---|---|---|
| Gauges | Report current values | `name:value\ | g` |
| Counters | Count events | `name:value\ | c/C/m` |
| Meters | Count events (rate-focused) | `name:value\ | m` |
| Timers | Statistical analysis of values (duration) | `name:value\ | ms` |
| Histograms | Statistical analysis of values (distribution) | `name:value\ | h` |
| Sets | Count unique occurrences | `name:value\ | s` |
| Dictionaries | Count occurrences of distinct values | `name:value\ | d` |
How StatsD Works with Netdata
flowchart TD
    A("Your Application") -->|"Sends metrics"| B("Netdata StatsD")
    B -->|"Creates"| C("Private Charts")
    B -->|"Creates"| D("Synthetic Charts")
    B -->|"Stores in"| E("Database")

    %% Style definitions
    classDef alert fill:#ffeb3b,stroke:#000000,stroke-width:3px,color:#000000,font-size:18px
    classDef neutral fill:#f9f9f9,stroke:#000000,stroke-width:3px,color:#000000,font-size:18px
    classDef complete fill:#4caf50,stroke:#000000,stroke-width:3px,color:#000000,font-size:18px
    classDef database fill:#2196F3,stroke:#000000,stroke-width:3px,color:#000000,font-size:18px

    %% Apply styles
    class A alert
    class B,C,D neutral
    class E complete
Netdata as a StatsD Server
Netdata comes with a fully-featured StatsD server built in. You can:
- Collect StatsD-formatted metrics
- Visualize them on the Netdata dashboard
- Store them in Netdata's database for long-term retention
Since StatsD is embedded in Netdata, you effectively have a StatsD server on every system where Netdata is installed.
:::note
Netdata's StatsD implementation is incredibly fast. It can collect several million metrics per second on modern hardware using just one CPU core. The implementation uses two threads: one collects metrics, and the other updates the charts.
:::
Pre-configured StatsD Applications
Netdata includes synthetic chart definitions to automatically present application metrics consistently. These are defined in configuration files that you can use as-is or customize.
For synthetic charts, you can set up alerts just like with any other metric or chart.
Currently available applications:
- K6 load testing tool
- Description: k6 is a developer-centric, free, and open-source load testing tool for performance testing
- Documentation
- Configuration
- Asterisk
- Description: Asterisk is an Open Source PBX and telephony toolkit
- Documentation
- Configuration
Supported Metric Types
Netdata fully supports the StatsD protocol and extends it for more advanced use cases. All StatsD client libraries are compatible with Netdata.
flowchart TD
    A("Application") -->|"Sends"| B("Metrics")
    B --> C("Gauges")
    B --> D("Counters")
    B --> E("Timers")
    B --> F("Histograms")
    B --> G("Sets")
    B --> H("Dictionaries")

    %% Style definitions
    classDef alert fill:#ffeb3b,stroke:#000000,stroke-width:3px,color:#000000,font-size:18px
    classDef neutral fill:#f9f9f9,stroke:#000000,stroke-width:3px,color:#000000,font-size:18px
    classDef complete fill:#4caf50,stroke:#000000,stroke-width:3px,color:#000000,font-size:18px
    classDef database fill:#2196F3,stroke:#000000,stroke-width:3px,color:#000000,font-size:18px

    %% Apply styles
    class A alert
    class B neutral
    class C,D,E,F,G,H complete
Gauges
Purpose: Report current values (e.g., cache memory used by an application server) **Format:** `name:value|g` - `value` can be any decimal/fractional number - StatsD reports the latest value and the number of updates (events) - You can increment/decrement previous values by prefixing with `+` or `-` - Sampling rate is supported - Tags can change chart units, family, and [dimension](https://learn.netdata.cloud/docs/developer-and-contributor-corner/glossary#d) name - When not collected, the last value will be shown if "show gaps" is disabled (default)
Counters and Meters
Purpose: Count events (e.g., number of file downloads) **Format:** `name:value|c`, `name:value|C`, or `name:value|m` - `value` must be an integer (positive or negative) - StatsD reports the rate and update count (events) - `:value` can be omitted (defaults to 1) - `|c`, `|C` and `|m` can be omitted (defaults to `|m`) - Counters use `|c` (etsy/StatsD compatible) or `|C` (brubeck compatible) - Meters use `|m` - Sampling rate is supported - Tags can change chart units, family, and dimension name - When not collected, StatsD shows zero until a new value arrives
Timers and Histograms
Purpose: Statistical analysis of values (e.g., request duration, file sizes) **Format:** `name:value|ms` or `name:value|h` - `value` can be any decimal/fractional number - StatsD reports min, max, average, 95th percentile, median, standard deviation, and update count - Timers use `|ms` and report in milliseconds - Histograms use `|h` - Sampling rate is supported - Tags can change chart units and family - When not collected, StatsD shows zero until a new value arrives
Sets
Purpose: Count unique occurrences (e.g., unique users, unique filenames) **Format:** `name:value|s` - `value` can be any string or number (leading/trailing spaces are removed) - StatsD reports the count of unique values and update count - Sampling rate is NOT supported - Values are always treated as text (so `01` and `1` are different) - Tags can change chart units and family - When not collected, StatsD shows zero until a new value arrives
Dictionaries
Purpose: Count occurrences of distinct values **Format:** `name:value|d` - `value` can be any string or number (leading/trailing spaces are removed) - StatsD reports the count of events for each `value` and total updates - Sampling rate is NOT supported - Values are always treated as text (so `01` and `1` are different) - Tags can change chart units and family - When not collected, StatsD shows zero until a new value arrives
Advanced Features
Sampling Rates
You can append `|@sampling_rate` to metrics, where `sampling_rate` is between 0.0 and 1.0. This tells StatsD to extrapolate the value for the entire period. Example: If your application reports data for only 1/10th of events, append `|@0.1` to have StatsD calculate the total.
Tags
You can append `|#tag1:value1,tag2:value2,tag3:value3` to metrics. Netdata currently uses these tags: - `units=string` - Sets the units of the automatically generated chart - `family=string` - Sets the family (dashboard submenu) of the chart - `name=string` - Sets the [dimension](https://learn.netdata.cloud/docs/developer-and-contributor-corner/glossary#d) name (for counters, meters, gauges only) :::tip For consistency, either send tags with every event or use the special `zinit` value to initialize charts. For example, send `my.metric:zinit|c|#units=bytes,name=size` at the beginning, then just `my.metric:VALUE|c` afterward. :::
Sending Multiple Metrics
You can send multiple metrics in a single packet by separating them with newlines (`\n`). #### TCP Packets Netdata listens for both TCP and UDP packets. With TCP, always append `\n` to each metric so Netdata can detect metrics split across multiple TCP packets. #### UDP Packets When sending multiple metrics in a UDP message, keep the total size under the network MTU (usually 1500 bytes). :::important Netdata can accept UDP datagrams up to the maximum UDP payload size (65,507 bytes for IPv4), but packets larger than the network MTU will be fragmented at the IP layer (or dropped if fragmentation is not allowed). :::
Configuration
You can find the StatsD configuration in /etc/netdata/netdata.conf:
[statsd]
    # enabled = yes
    # decimal detail = 1000
    # update every (flushInterval) = 1s
    # udp messages to process at once = 10
    # create private charts for metrics matching = *
    # max private charts hard limit = 1000
    # cleanup obsolete charts after = 0
    # private charts memory mode = save
    # private charts history = 3996
    # histograms and timers percentile (percentThreshold) = 95.00000
    # add dimension for number of events received = no
    # gaps on gauges (deleteGauges) = no
    # gaps on counters (deleteCounters) = no
    # gaps on meters (deleteMeters) = no
    # gaps on sets (deleteSets) = no
    # gaps on histograms (deleteHistograms) = no
    # gaps on timers (deleteTimers) = no
    # listen backlog = 4096
    # default port = 8125
    # bind to = udp:localhost:8125 tcp:localhost:8125
Configuration Architecture
How the StatsD Configuration Works
Netdata's StatsD chart system uses three key sections in its configuration:
flowchart TD
    A("statsd.d config") --> B("app")
    A --> C("dictionary")
    A --> D("chart definitions")
    B --> E("metric filtering")
    C --> F("renaming for display")
    D --> G("chart family/context/units/priorities")

    %% Style definitions
    classDef alert fill:#ffeb3b,stroke:#000000,stroke-width:3px,color:#000000,font-size:18px
    classDef neutral fill:#f9f9f9,stroke:#000000,stroke-width:3px,color:#000000,font-size:18px
    classDef complete fill:#4caf50,stroke:#000000,stroke-width:3px,color:#000000,font-size:18px
    classDef database fill:#2196F3,stroke:#000000,stroke-width:3px,color:#000000,font-size:18px

    %% Apply styles
    class A alert
    class B,C,D neutral
    class E,F,G complete
The diagram shows how the configuration flows:
The central
statsd.d configconnects to three main components:- The application configuration
- The dictionary system
- Chart definitions
Each of these components serves a specific purpose:
- The app component handles metric filtering
- The dictionary manages renaming metrics for display
- Chart definitions determine properties like family, context, units, and priorities
This structure allows for flexible and powerful metric configuration within Netdata's StatsD implementation.
Key Configuration Options
enabled = yes|no- Controls whether StatsD is enableddefault port = 8125- The default port if not specified in bindingbind to = udp:localhost tcp:localhost- Space-separated list of IPs and ports to listen onupdate every (flushInterval) = 1s- How often StatsD updates Netdata chartsdecimal detail = 1000- Controls decimal precision in gauges and histograms
StatsD Charts
Netdata can visualize StatsD collected metrics in two ways:
- Private charts - Each metric gets its own chart (default, no configuration needed)
- Synthetic charts - Combine multiple metrics into custom charts (requires configuration)
Private Metric Charts
Private charts are controlled with create private charts for metrics matching = *. This setting accepts a space-separated list of simple patterns. By default, Netdata creates private charts for all metrics.
Private Chart Naming Convention
When querying StatsD metrics via the Netdata API, you must use the chart identifier that Netdata constructs from the metric name — not the raw metric name you sent to StatsD. The chart identifier is built as follows:
- Chart type =
statsd_<first_word>— where<first_word>is the portion of the metric name before the first.or_. - Chart id =
<remaining>_<metric_type>— where<remaining>is the portion after the first.or_, and<metric_type>is one of:gauge,counter,meter,timer,histogram,set, ordictionary. If the metric name has no.or_, the chart id is just the<metric_type>. - Full chart reference =
<chart_type>.<chart_id>— use this as thechartparameter in API queries.
| Metric sent | Metric type | Chart type | Chart ID | Full chart reference |
|---|---|---|---|---|
| `test.metric:100\ | c` | counter | statsd_test |
metric_counter |
| `myapp.used_memory:12345\ | g` | gauge | statsd_myapp |
used_memory_gauge |
| `myapp.requests:50\ | ms` | timer | statsd_myapp |
requests_timer |
:::tip
To discover the exact chart names available on your agent, run:
curl http://localhost:19999/api/v1/charts
Filter the results for IDs starting with statsd_. Use the returned chart id field (in type.id format) as the chart parameter in data queries.
:::
:::info
Troubleshooting "No metrics where matched to query": This error typically occurs when you use the raw StatsD metric name (e.g., statsd.test.metric) as the chart parameter instead of the constructed chart reference (e.g., statsd_test.metric_counter). To resolve this, verify the correct chart name using /api/v1/charts before querying metric data.
For example, after sending test.metric:100|c via StatsD, the correct query is:
curl "http://localhost:19999/api/v1/data?chart=statsd_test.metric_counter&after=-10&before=now"
The chart name statsd_test.metric_counter follows the type.id convention: type statsd_test (prefix + first dot-delimited word) and id metric_counter (remaining words + metric type).
:::
Example: To create charts for all myapp.* metrics except myapp.*.badmetric:
create private charts for metrics matching = !myapp.*.badmetric myapp.*
You can configure a different memory mode specifically for StatsD charts:
private charts memory modeprivate charts history
Private Chart Examples
Example of a gauge metric chart:  Example of a histogram metric chart:  Histogram chart with "sum" unselected:  Example of a counter metric chart:  Example of a meter metric chart:  Example of a set metric chart:  Example of a timer metric chart: 
Storage Optimization
For performance reasons, Netdata limits private charts. The max private charts hard limit (default: 1000) controls this. Metrics above this limit can still be used in synthetic charts.
For ephemeral metrics, use set charts as obsolete after and cleanup obsolete charts after to automatically clean up charts that haven't received data recently.
Synthetic StatsD Charts
Use synthetic charts to create dedicated sections on the dashboard to render your StatsD charts.
flowchart TD
    A("StatsD Metrics") --> B("App")
    A --> C("Dictionary")
    B --> D("Chart")
    C --> D
    D --> E("Dashboard")

    %% Style definitions
    classDef alert fill:#ffeb3b,stroke:#000000,stroke-width:3px,color:#000000,font-size:18px
    classDef neutral fill:#f9f9f9,stroke:#000000,stroke-width:3px,color:#000000,font-size:18px
    classDef complete fill:#4caf50,stroke:#000000,stroke-width:3px,color:#000000,font-size:18px
    classDef database fill:#2196F3,stroke:#000000,stroke-width:3px,color:#000000,font-size:18px

    %% Apply styles
    class A alert
    class B,C neutral
    class D,E complete
Synthetic charts are organized in:
- Application - Section in Netdata Dashboard
- Charts for each application - Family/submenu in the Dashboard
- StatsD metrics for each chart - Charts and context in the Dashboard
Basic Configuration Structure
For example, to monitor the application myapp using StatsD and Netdata, create the file /etc/netdata/statsd.d/myapp.conf:
[app]
    name = myapp
    metrics = myapp.*
    private charts = no
    gaps when not collected = no
    history = 60

[dictionary]
    m1 = metric1
    m2 = metric2

# Chart definition with ID 'mychart'
# The chart will be named: myapp.mychart
[mychart]
    name = mychart
    title = my chart title
    family = my family
    context = chart.context
    units = tests/s
    priority = 91000
    type = area
    dimension = myapp.metric1 m1
    dimension = myapp.metric2 m2
Using this configuration, myapp gets its own dashboard section with one chart containing two dimensions.
When you send metrics like foo:10|g and bar:20|g, you'll see both private charts and your synthetic chart.
Synthetic Chart Example
Example of a synthetic chart combining multiple metrics: 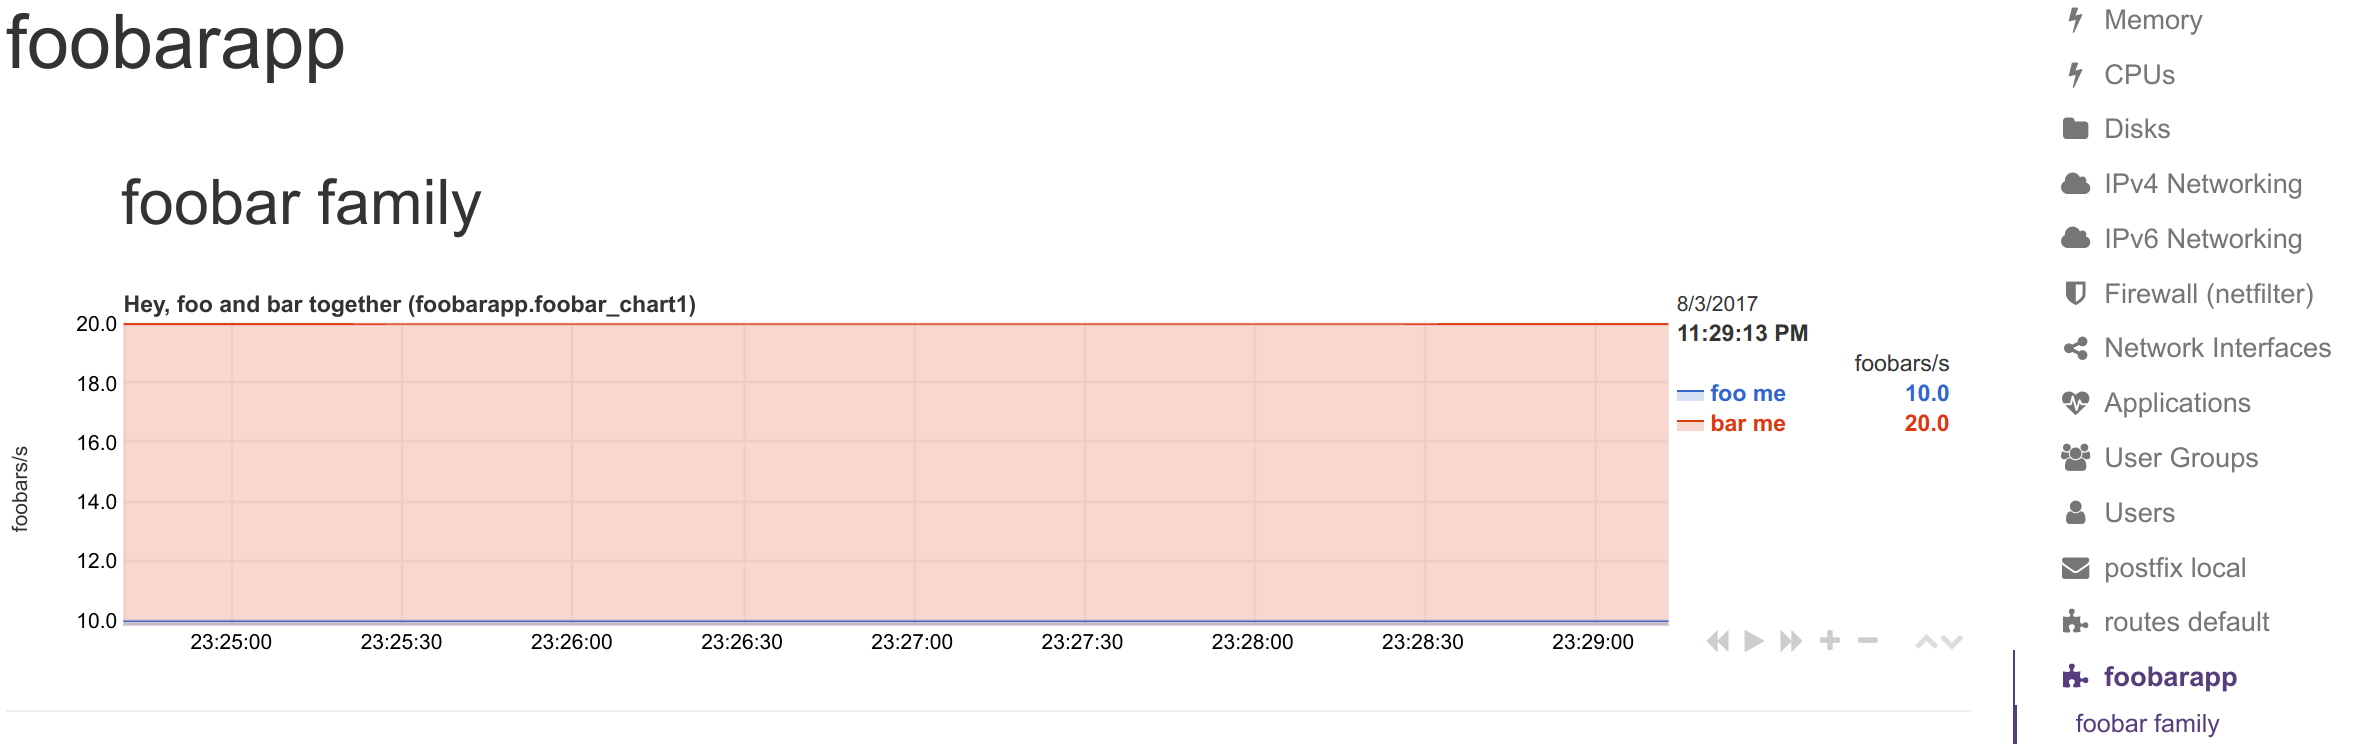
Application Section Options
The [app] section defines the application and has these options:
:::note
- name - Defines the application name
- metrics - Simple pattern matching all metrics for this app
- private charts - Enable/disable private charts for matched metrics (yes|no)
- gaps when not collected - Show gaps when no metrics are collected (yes|no)
- memory mode - Sets memory mode for application charts (optional, default is global Netdata setting)
- history - Size of round-robin database (optional, only relevant with
memory mode = save)
:::
Dictionary Section
[dictionary] defines name-value pairs for renaming metrics in synthetic charts. This allows you to:
- Define dimension names globally for the whole app
- Rename dimensions when using patterns
- Create more human-readable names for technical metrics
The dictionary can be empty or omitted if not needed.
Chart Definitions
Each chart starts with [id] and will be named app_name.id. Key settings for charts:
:::note
- family - Controls dashboard submenu placement
- context - Controls alert templates
- priority - Controls chart ordering
- type - Chart visualization type (line, area, stacked)
- units - Chart measurement units
:::
Dimension Format
Add metrics to charts using dimension lines with this format:
dimension = [pattern] METRIC NAME TYPE MULTIPLIER DIVIDER OPTIONS
Where:
- METRIC - The metric name as collected (must match the
metricspattern) - NAME - The dimension name to display (can use dictionary for renaming)
- TYPE - (Optional) Value selector like
events,last,min,max, etc. - MULTIPLIER - (Optional) Value to multiply the metric by
- DIVIDER - (Optional) Value to divide the metric by
- OPTIONS - (Optional) Flags like
hiddento include but not display a dimension
Renaming StatsD Synthetic Charts' Metrics
You can define a dictionary to rename metrics sent by StatsD clients. This allows you to transmit the response code `200` while Netdata displays it as `successful connection`. The `[dictionary]` section accepts any number of `name = value` pairs. Netdata uses this dictionary as follows: 1. When a `dimension` has a non-empty `NAME`, that name is looked up in the dictionary 2. If the above lookup finds nothing, the original StatsD metric name is looked up 3. If any lookup succeeds, Netdata uses the dictionary's `value` for the dimension name The dimensions will have the original StatsD metric name as ID and the dictionary value as name. You can use the dictionary in two ways: 1. Set `dimension = myapp.metric1 ''` and have in the dictionary `myapp.metric1 = metric1 name` 2. Set `dimension = myapp.metric1 'm1'` and have in the dictionary `m1 = metric1 name` In both cases, the dimension will be added with ID `myapp.metric1` and named `metric1 name`. In alerts, you can reference it as either `${myapp.metric1}` or `${metric1 name}`. :::note If you add the same StatsD metric multiple times to a chart, Netdata will append `TYPE` to the dimension ID, so `myapp.metric1` will become `myapp.metric1_last` or `myapp.metric1_events`. If you add the same metric with the same `TYPE` multiple times, Netdata will also append an incremental counter, e.g., `myapp.metric1_last1`, `myapp.metric1_last2`, etc. :::
Dimension Patterns
Netdata allows adding multiple dimensions to a chart by matching StatsD metrics with a **pattern**. For example, if you have an API that provides StatsD metrics for each response code per method: ``` myapp.api.get.200 myapp.api.get.400 myapp.api.get.500 myapp.api.del.200 myapp.api.del.400 myapp.api.del.500 myapp.api.post.200 myapp.api.post.400 myapp.api.post.500 myapp.api.all.200 myapp.api.all.400 myapp.api.all.500 ``` To add all response codes of `myapp.api.get` to a chart: ``` [api_get_responses] ... dimension = pattern 'myapp.api.get.* '' last 1 1 ``` This adds dimensions named `200`, `400`, and `500`. Netdata extracts the wildcard part of the metric name. You can rename these dimensions with the dictionary: ``` [dictionary] get.200 = 200 ok get.400 = 400 bad request get.500 = 500 cannot connect to db [api_get_responses] ... dimension = pattern 'myapp.api.get.* 'get.' last 1 1 ``` The `NAME` prefix `get.` is combined with the wildcarded part to look up in the dictionary. So `500` becomes `get.500`, which is looked up to find `500 cannot connect to db`. ### More Pattern Examples To add all 200s across all API methods to a chart: ``` [ok_by_method] ... dimension = pattern 'myapp.api.*.200 '' last 1 1 ``` This adds `get`, `post`, `del`, and `all` to the chart. To exclude the `all` method: ``` [ok_by_method] ... dimension = pattern '!myapp.api.all.* myapp.api.*.200 '' last 1 1 ``` To rename methods automatically: ``` [dictionary] method.get = GET method.post = ADD method.del = DELETE [ok_by_method] ... dimension = pattern '!myapp.api.all.* myapp.api.*.200 'method.' last 1 1 ``` This adds dimensions named `GET`, `ADD`, and `DELETE`.
Using StatsD with Different Languages
Python
Using [jsocol/pystatsd](https://github.com/jsocol/pystatsd): ```python import statsd c = statsd.StatsClient('localhost', 8125) c.incr('foo') # Increment the 'foo' counter. for i in range(100000000): c.incr('bar') c.incr('foo') if i % 3: c.decr('bar') c.timing('stats.timed', 320) # Record a 320ms 'stats.timed'. ``` See the [full documentation](https://statsd.readthedocs.io/en/v3.3/) for more details.
JavaScript and Node.js
Using [sivy/node-statsd](https://github.com/sivy/node-statsd): ```javascript var StatsD = require('node-statsd'), client = new StatsD(); // Timing: sends a timing command with the specified milliseconds client.timing('response_time', 42); // Increment: Increments a stat by a value (default is 1) client.increment('my_counter'); // Decrement: Decrements a stat by a value (default is -1) client.decrement('my_counter'); // Using the callback client.set(['foo', 'bar'], 42, function (error, bytes) { //this only gets called once after all messages have been sent if (error) { console.error('Oh noes! There was an error:', error); } else { console.log('Successfully sent', bytes, 'bytes'); } }); // Sampling, tags and callback are optional and could be used in any combination client.histogram('my_histogram', 42, 0.25); // 25% Sample Rate client.histogram('my_histogram', 42, ['tag']); // User-defined tag client.histogram('my_histogram', 42, next); // Callback client.histogram('my_histogram', 42, 0.25, ['tag']); client.histogram('my_histogram', 42, 0.25, next); client.histogram('my_histogram', 42, ['tag'], next); client.histogram('my_histogram', 42, 0.25, ['tag'], next); ```
Other Languages
StatsD clients are available for many languages: - Golang: [alexcesaro/statsd](https://github.com/alexcesaro/statsd) - Ruby: [reinh/statsd](https://github.com/reinh/statsd) - Java: [DataDog/java-dogstatsd-client](https://github.com/DataDog/java-dogstatsd-client)
Shell Script
You can use the Unix shell with `nc` to send StatsD metrics from any script. :::important You'll need the `netcat` package with the `nc` command. Different versions have different parameters, so experiment to find what works on your system. The examples below assume `openbsd-netcat` is installed. ::: #### Using UDP (for sporadic events) ```sh echo "APPLICATION.METRIC:VALUE|TYPE" | nc -u -w 0 localhost 8125 ``` - `-u` enables UDP - `-w 0` tells `nc` not to wait for a response Examples: ```sh # Set a gauge value echo "myapp.used_memory:123456|g|#units:bytes" | nc -u -w 0 localhost 8125 # Increment a counter echo "myapp.files_sent:10|c|#units:files" | nc -u -w 0 localhost 8125 # Send multiple metrics printf "myapp.used_memory:123456|g|#units:bytes\nmyapp.files_sent:10|c|#units:files\n" | nc -u -w 0 localhost 8125 ``` #### Using TCP (for many metrics at once) ```sh # send multiple metrics via TCP cat /tmp/statsd.metrics.txt | nc -N -w 120 localhost 8125 ``` #### Helper Function for Shell Scripts This function handles both UDP and TCP automatically: ```sh #!/usr/bin/env bash # we assume nc is from the openbsd-netcat package STATSD_HOST="localhost" STATSD_PORT="8125" statsd() { local options="-u -w 0" all="${*}" # replace all spaces with newlines all="${all// /\\n}" # if the string length of all parameters given is above 1000, use TCP [ "${#all}" -gt 1000 ] && options="-N -w 0" # send the metrics to statsd printf "${all}\n" | nc ${options} ${STATSD_HOST} ${STATSD_PORT} || return 1 return 0 } if [ ! -z "${*}" ] then statsd "${@}" fi ``` Usage: ```sh # source it in your script source statsd.sh # then use it anywhere statsd "myapp.used_memory:123456|g|#units:bytes" "myapp.files_sent:10|c|#units:files" ... # or at command line ./statsd.sh "myapp.used_memory:123456|g|#units:bytes" "myapp.files_sent:10|c|#units:files" ... ``` The function automatically switches to TCP if the metrics exceed 1000 bytes.
Step-by-Step Guide: Monitoring K6 with StatsD
This guide demonstrates how to use Netdata's StatsD to visualize metrics from k6, an open-source load testing tool.
Prerequisites
- A node with [Netdata](https://github.com/netdata/netdata/blob/master/packaging/installer/README.md) installed - [k6](https://k6.io/docs/getting-started/installation) installed
The Process in Brief
1. **Run an experiment** sending StatsD metrics to Netdata without configuration - This creates a private chart per metric - Reload the dashboard after starting to send data 2. **Create a configuration file** for your app: ``` sudo ./edit-config statsd.d/myapp.conf ``` - This organizes metrics into meaningful sections
Understanding Your Metrics
First, understand what metrics your application provides. For k6, check their [metrics documentation](https://k6.io/docs/using-k6/metrics/). When instrumenting your own code, you'll need to decide: - What to measure - Which StatsD metric type is appropriate for each measurement
Exploring Available Metrics with Private Charts
Every StatsD metric initially gets its own "private chart." While you'll likely disable this in production, it's helpful during setup to see all available metrics. Private charts clearly show the metric type (gauge, timer, etc.) and available operations for complex types like histograms.
Creating a StatsD Configuration File
Use Netdata's [`edit-config`](https://github.com/netdata/netdata/blob/master/docs/netdata-agent/configuration/README.md#edit-configuration-files) to create a new file: ```bash sudo ./edit-config statsd.d/k6.conf ``` Start with this basic configuration: ``` [app] name = k6 metrics = k6* private charts = yes gaps when not collected = no memory mode = dbengine ```
Organizing Metrics
Next, decide how to organize metrics in the Netdata dashboard: 1. **Dictionary** - Create human-readable names for technical metrics ``` [dictionary] http_req_blocked = Blocked HTTP Requests http_req_connecting = Connecting HTTP Requests http_req_receiving = Receiving HTTP Requests http_reqs = Total HTTP requests ``` 2. **Families** - Group charts into dashboard submenus. For k6, we'll use `k6 native metrics` and `http metrics` families. 3. **[Dimensions](https://learn.netdata.cloud/docs/developer-and-contributor-corner/glossary#d)** - Choose which metrics to show and how to group them in charts
Complete Configuration Example
Here's a complete configuration for k6: ``` [app] name = k6 metrics = k6* private charts = yes gaps when not collected = no memory mode = dbengine [dictionary] http_req_blocked = Blocked HTTP Requests http_req_connecting = Connecting HTTP Requests http_req_receiving = Receiving HTTP Requests http_reqs = Total HTTP requests [http_req_total] name = http_req_total title = Total HTTP Requests family = http requests context = k6.http_requests dimension = k6.http_reqs http_reqs last 1 1 sum type = line units = requests/s [vus] name = vus title = Virtual Active Users family = k6_metrics dimension = k6.vus vus last 1 1 dimension = k6.vus_max vus_max last 1 1 type = line unit = vus [iteration_duration] name = iteration_duration_2 title = Iteration duration family = k6_metrics dimension = k6.iteration_duration iteration_duration last 1 1 dimension = k6.iteration_duration iteration_duration_max max 1 1 dimension = k6.iteration_duration iteration_duration_min min 1 1 dimension = k6.iteration_duration iteration_duration_avg avg 1 1 type = line unit = s [dropped_iterations] name = dropped_iterations title = Dropped Iterations family = k6_metrics dimension = k6.dropped_iterations dropped_iterations last 1 1 units = iterations type = line [data] name = data title = K6 Data family = k6_metrics dimension = k6.data_received data_received last 1 1 dimension = k6.data_sent data_sent last -1 1 units = kb/s type = area [http_req_status] name = http_req_status title = HTTP Requests Status family = http requests dimension = k6.http_req_blocked http_req_blocked last 1 1 dimension = k6.http_req_connecting http_req_connecting last 1 1 units = ms type = line [http_req_duration] name = http_req_duration title = HTTP requests duration family = http requests dimension = k6.http_req_sending http_req_sending last 1 1 dimension = k6.http_req_waiting http_req_waiting last 1 1 dimension = k6.http_req_receiving http_req_receiving last 1 1 units = ms type = stacked ``` :::note Netdata will report the rate for metrics and counters even if your application sends absolute numbers. For example, k6 sends absolute HTTP requests with `http_reqs`, but Netdata visualizes that as `requests/second`. ::: Restart Netdata to enable this configuration.
Adding Custom Icons and Descriptions
You can customize the section icon and add helpful chart descriptions. Create a custom dashboard info file: ```javascript netdataDashboard.menu = { 'k6': { title: 'K6 Load Testing', icon: '', info: 'k6 is an open-source load testing tool and cloud service providing the best developer experience for API performance testing.' }, }; netdataDashboard.context = { 'k6.http_req_duration': { info: "Total time for the request. It's equal to http_req_sending + http_req_waiting + http_req_receiving (i.e. how long did the remote server take to process the request and respond, without the initial DNS lookup/connection times)" }, }; ``` These descriptions help users monitor your application, especially during incidents. The `info` field supports HTML, allowing you to embed links and instructions.
Contributing Your Collector
Once you've created a working configuration, consider sharing it with the Netdata community: 1. Follow the [contributing guide](https://github.com/netdata/.github/blob/main/CONTRIBUTING.md) 2. Fork the netdata/netdata repository 3. Place your configuration file in `netdata/collectors/statsd.plugin` 4. Add a reference in `netdata/collectors/statsd.plugin/Makefile.am`