| 1 | # Kubernetes monitoring with Netdata |
| 2 | |
| 3 | This document gives an overview of what visualizations Netdata provides on Kubernetes deployments. |
| 4 | |
| 5 | At Netdata, we've built Kubernetes monitoring tools that add visibility without complexity while also helping you |
| 6 | actively troubleshoot anomalies or outages. This guide walks you through each of the visualizations and offers best |
| 7 | practices on how to use them to start Kubernetes monitoring in a matter of minutes, not hours or days. |
| 8 | |
| 9 | Netdata's Kubernetes monitoring solution uses a handful of [complementary tools and |
| 10 | collectors](#related-reference-documentation) for peeling back the many complex layers of a Kubernetes cluster, |
| 11 | _entirely for free_. These methods work together to give you every metric you need to troubleshoot performance or |
| 12 | availability issues across your Kubernetes infrastructure. |
| 13 | |
| 14 | ## Challenge |
| 15 | |
| 16 | While Kubernetes (k8s) might simplify the way you deploy, scale, and load-balance your applications, not all clusters |
| 17 | come with "batteries included" when it comes to monitoring. Doubly so for a monitoring stack that helps you actively |
| 18 | troubleshoot issues with your cluster. |
| 19 | |
| 20 | Some k8s providers, like GKE (Google Kubernetes Engine), do deploy clusters bundled with monitoring capabilities, such |
| 21 | as Google Stackdriver Monitoring. However, these pre-configured solutions might not offer the depth of metrics, |
| 22 | customization, or integration with your preferred alerting methods. |
| 23 | |
| 24 | Without this visibility, it's like you built an entire house and _then_ smashed your way through the finished walls to |
| 25 | add windows. |
| 26 | |
| 27 | ## Solution |
| 28 | |
| 29 | In this tutorial, you'll learn how to navigate Netdata's Kubernetes monitoring features, using |
| 30 | [robot-shop](https://github.com/instana/robot-shop) as an example deployment. Deploying robot-shop is purely optional. |
| 31 | You can also follow along with your own Kubernetes deployment if you choose. While the metrics might be different, the |
| 32 | navigation and best practices are the same for every cluster. |
| 33 | |
| 34 | ## What you need to get started |
| 35 | |
| 36 | To follow this tutorial, you need: |
| 37 | |
| 38 | - A free Netdata Cloud account. [Sign up](https://app.netdata.cloud/sign-up?cloudRoute=/spaces) if you don't have one |
| 39 | already. |
| 40 | - A working cluster running Kubernetes v1.9 or newer, with a Netdata deployment and connected parent/child nodes. See |
| 41 | our [Kubernetes deployment process](/packaging/installer/methods/kubernetes.md) for details on deployment and |
| 42 | connecting to Cloud. |
| 43 | - The [`kubectl`](https://kubernetes.io/docs/reference/kubectl/overview/) command line tool, within [one minor version |
| 44 | difference](https://kubernetes.io/docs/tasks/tools/install-kubectl/#before-you-begin) of your cluster, on an |
| 45 | administrative system. |
| 46 | - The [Helm package manager](https://helm.sh/) v3.0.0 or newer on the same administrative system. |
| 47 | |
| 48 | ### Install the `robot-shop` demo (optional) |
| 49 | |
| 50 | Begin by downloading the robot-shop code and using `helm` to create a new deployment. |
| 51 | |
| 52 | ```bash |
| 53 | git clone git@github.com:instana/robot-shop.git |
| 54 | cd robot-shop/K8s/helm |
| 55 | kubectl create ns robot-shop |
| 56 | helm install robot-shop --namespace robot-shop . |
| 57 | ``` |
| 58 | |
| 59 | Running `kubectl get pods` shows both the Netdata and robot-shop deployments. |
| 60 | |
| 61 | ```bash |
| 62 | kubectl get pods --all-namespaces |
| 63 | NAMESPACE NAME READY STATUS RESTARTS AGE |
| 64 | default netdata-child-29f9c 2/2 Running 0 10m |
| 65 | default netdata-child-8xphf 2/2 Running 0 10m |
| 66 | default netdata-child-jdvds 2/2 Running 0 11m |
| 67 | default netdata-parent-554c755b7d-qzrx4 1/1 Running 0 11m |
| 68 | kube-system aws-node-jnjv8 1/1 Running 0 17m |
| 69 | kube-system aws-node-svzdb 1/1 Running 0 17m |
| 70 | kube-system aws-node-ts6n2 1/1 Running 0 17m |
| 71 | kube-system coredns-559b5db75d-f58hp 1/1 Running 0 22h |
| 72 | kube-system coredns-559b5db75d-tkzj2 1/1 Running 0 22h |
| 73 | kube-system kube-proxy-9p9cd 1/1 Running 0 17m |
| 74 | kube-system kube-proxy-lt9ss 1/1 Running 0 17m |
| 75 | kube-system kube-proxy-n75t9 1/1 Running 0 17m |
| 76 | robot-shop cart-b4bbc8fff-t57js 1/1 Running 0 14m |
| 77 | robot-shop catalogue-8b5f66c98-mr85z 1/1 Running 0 14m |
| 78 | robot-shop dispatch-67d955c7d8-lnr44 1/1 Running 0 14m |
| 79 | robot-shop mongodb-7f65d86c-dsslc 1/1 Running 0 14m |
| 80 | robot-shop mysql-764c4c5fc7-kkbnf 1/1 Running 0 14m |
| 81 | robot-shop payment-67c87cb7d-5krxv 1/1 Running 0 14m |
| 82 | robot-shop rabbitmq-5bb66bb6c9-6xr5b 1/1 Running 0 14m |
| 83 | robot-shop ratings-94fd9c75b-42wvh 1/1 Running 0 14m |
| 84 | robot-shop redis-0 0/1 Pending 0 14m |
| 85 | robot-shop shipping-7d69cb88b-w7hpj 1/1 Running 0 14m |
| 86 | robot-shop user-79c445b44b-hwnm9 1/1 Running 0 14m |
| 87 | robot-shop web-8bb887476-lkcjx 1/1 Running 0 14m |
| 88 | ``` |
| 89 | |
| 90 | ## Explore Netdata's Kubernetes monitoring charts |
| 91 | |
| 92 | The Netdata Helm chart deploys and enables everything you need for monitoring Kubernetes on every layer. Once you deploy |
| 93 | Netdata and connect your cluster's nodes, you're ready to check out the visualizations **with zero configuration**. |
| 94 | |
| 95 | To get started, [sign in](https://app.netdata.cloud/sign-in?cloudRoute=/spaces) to your Netdata Cloud account. Head over |
| 96 | to the Room you connected your cluster to, if not **General**. |
| 97 | |
| 98 | Let's walk through monitoring each layer of a Kubernetes cluster using the Overview as our framework. |
| 99 | |
| 100 | ## Cluster and node metrics |
| 101 | |
| 102 | The gauges and time-series charts you see right away in the Overview show aggregated metrics from every node in your |
| 103 | cluster. |
| 104 | |
| 105 | For example, the `apps.cpu` chart (in the **Applications** menu item), visualizes the CPU utilization of various |
| 106 | applications/services running on each of the nodes in your cluster. The **X Nodes** dropdown shows which nodes |
| 107 | contribute to the chart and links to jump a single-node dashboard for further investigation. |
| 108 | |
| 109 | 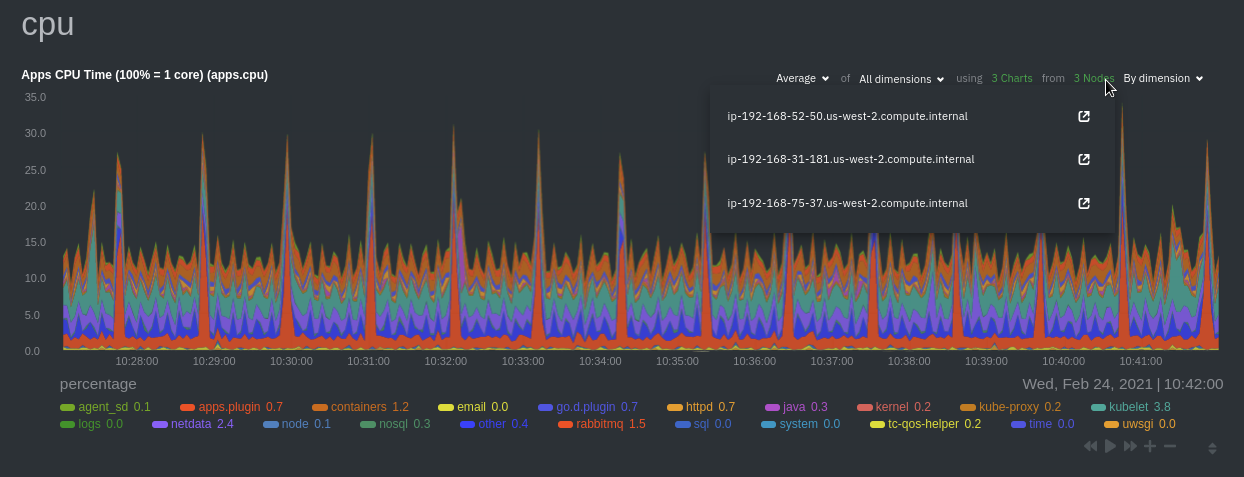 |
| 111 | |
| 112 | For example, the chart above shows a spike in the CPU utilization from `rabbitmq` every minute or so, along with a |
| 113 | baseline CPU utilization of 10-15% across the cluster. |
| 114 | |
| 115 | ## Pod and container metrics |
| 116 | |
| 117 | Click on the **Kubernetes xxxxxxx...** section to jump down to Netdata Cloud's unique Kubernetes visualizations for view |
| 118 | real-time resource utilization metrics from your Kubernetes pods and containers. |
| 119 | |
| 120 | 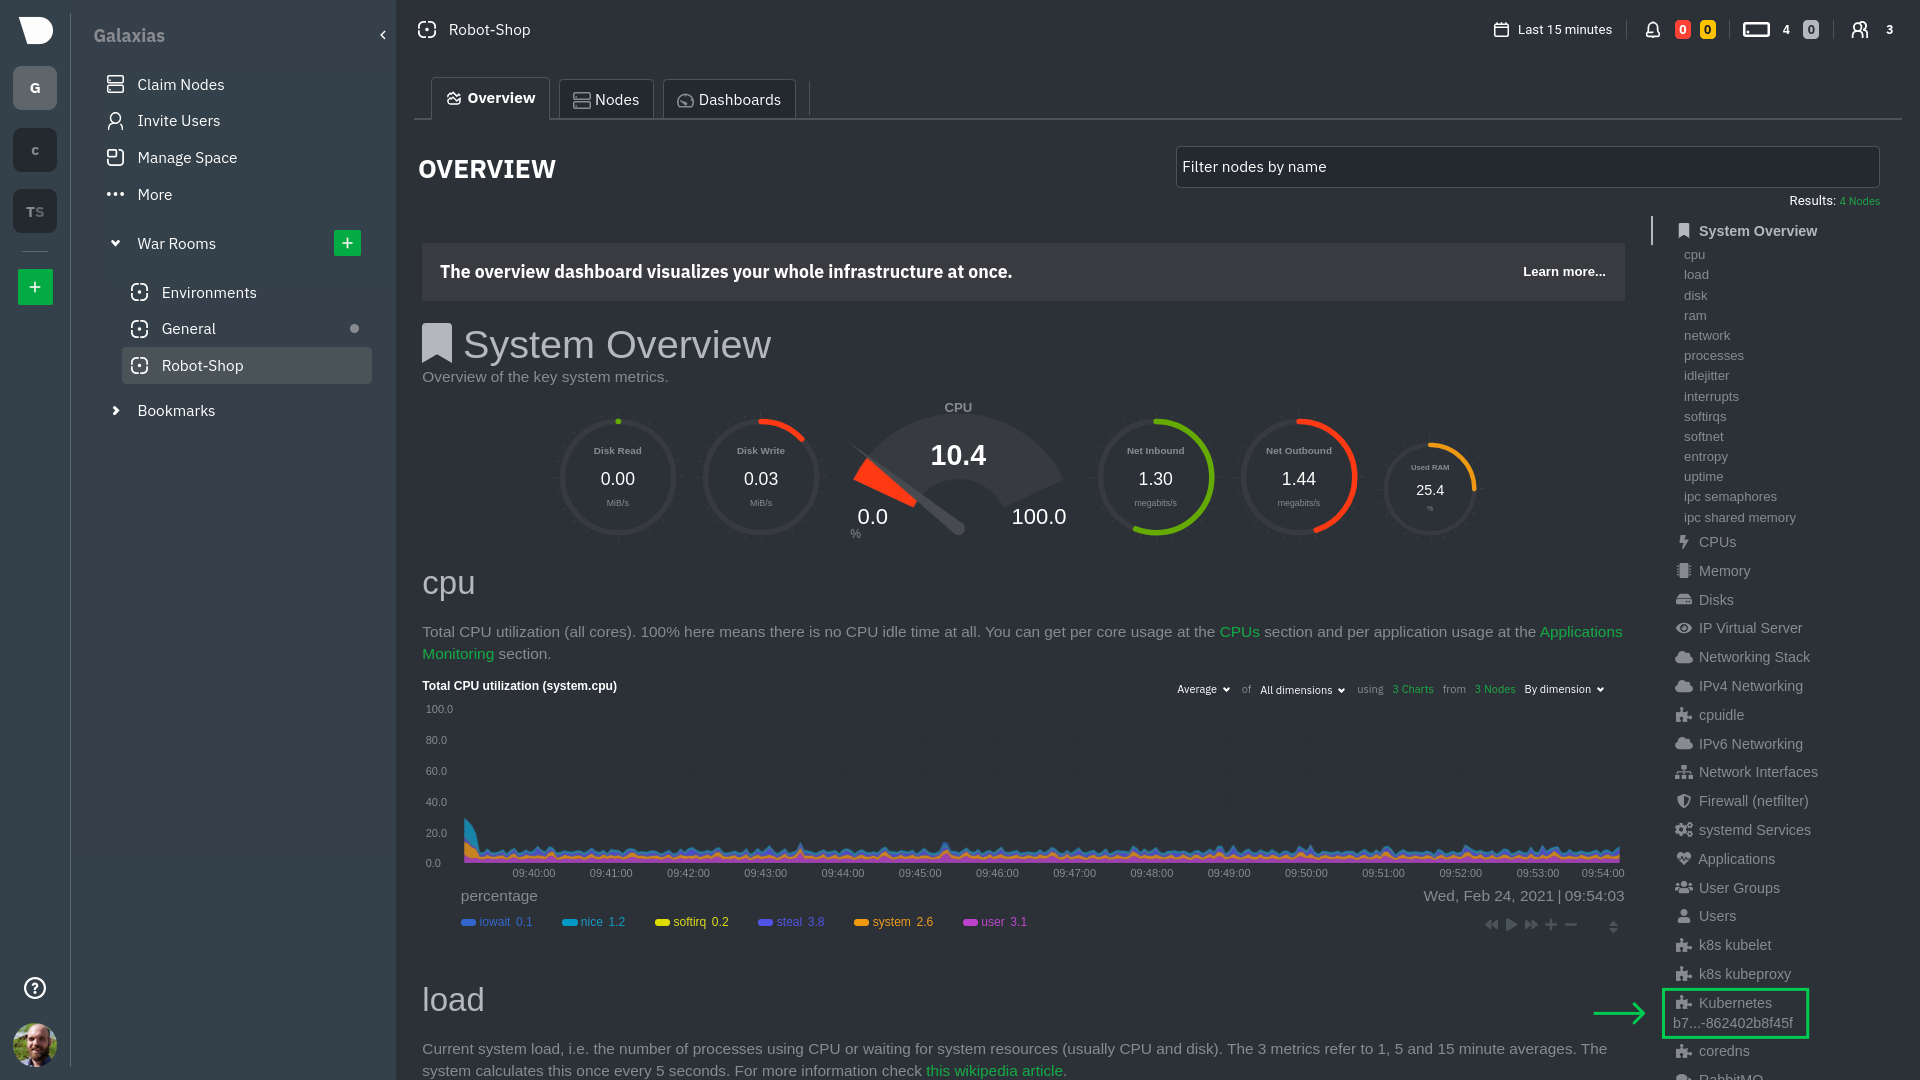 |
| 122 | |
| 123 | ### Health map |
| 124 | |
| 125 | The first visualization is the [health map](/docs/dashboards-and-charts/kubernetes-tab.md#health-map), |
| 126 | which places each container into its own box, then varies the intensity of their color to visualize the resource |
| 127 | utilization. By default, the health map shows the **average CPU utilization as a percentage of the configured limit** |
| 128 | for every container in your cluster. |
| 129 | |
| 130 | 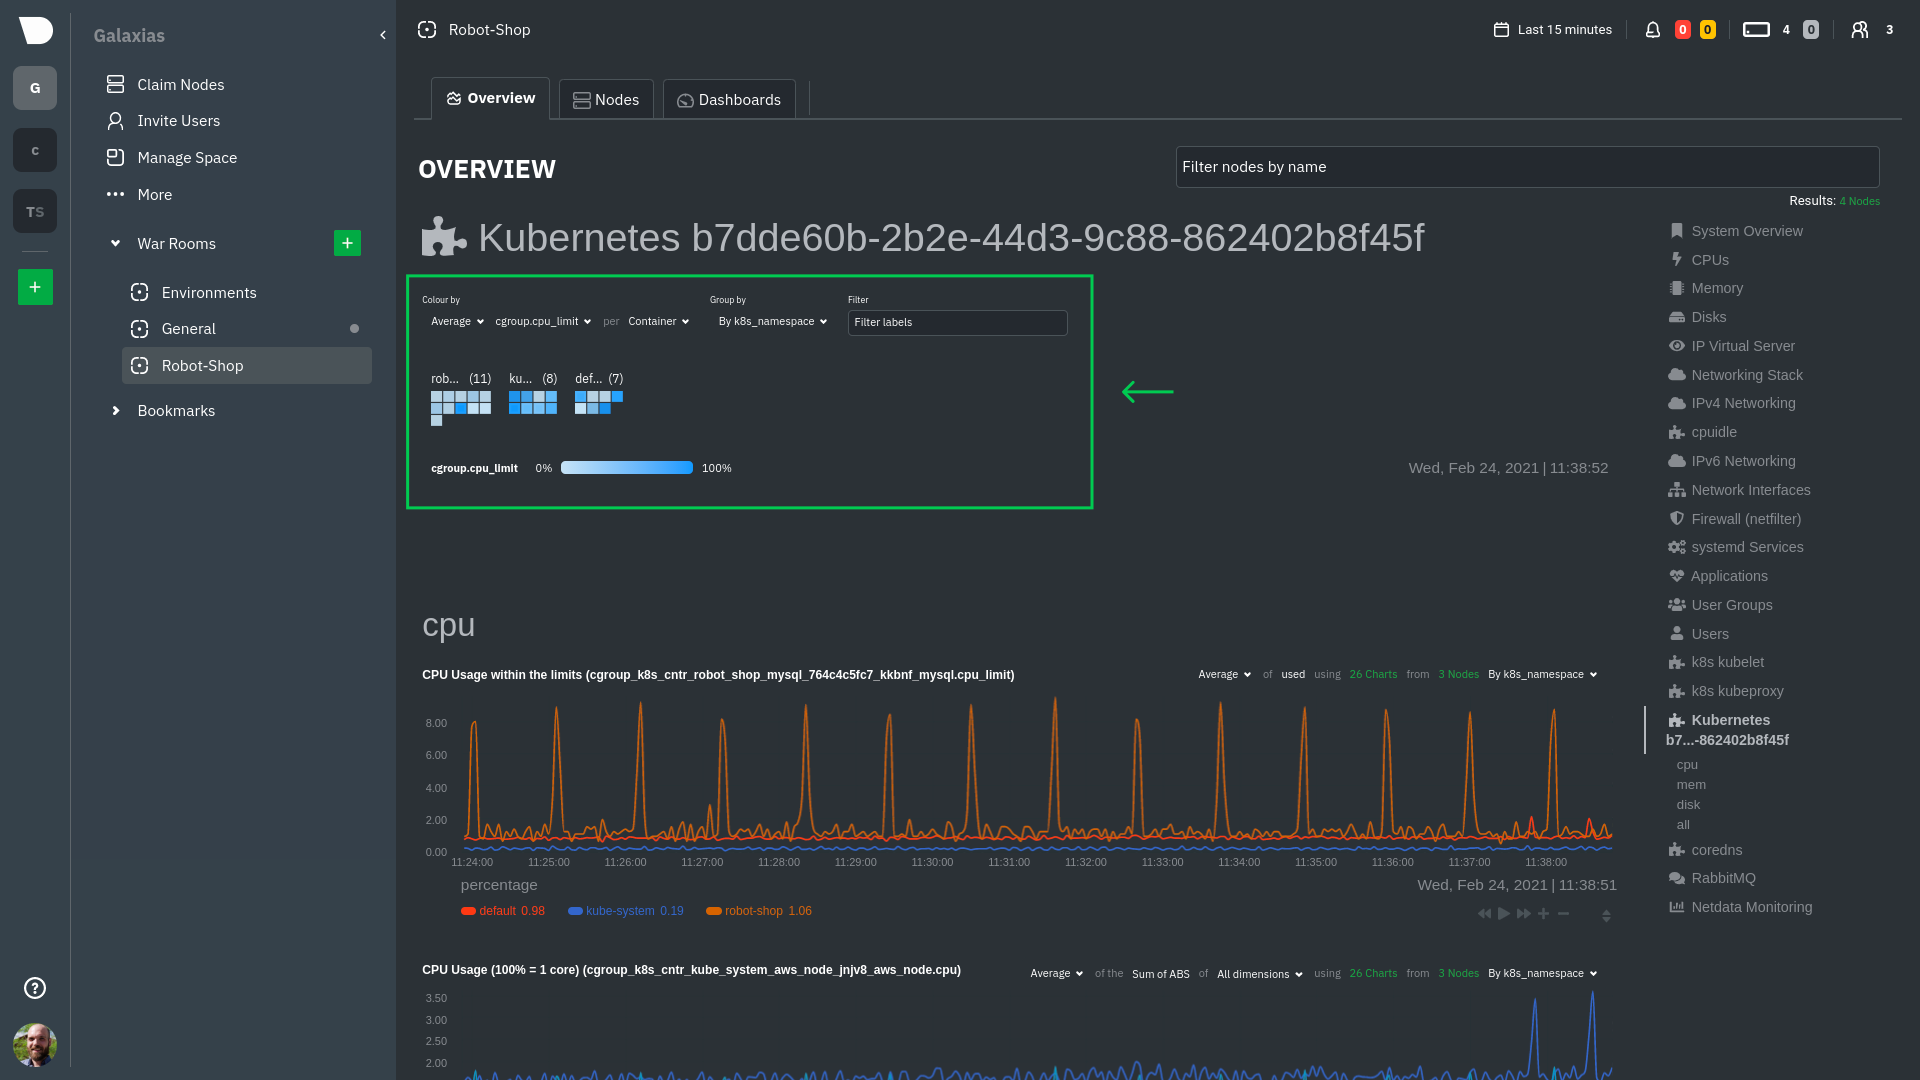 |
| 132 | |
| 133 | Let's explore the most colorful box by hovering over it. |
| 134 | |
| 135 | 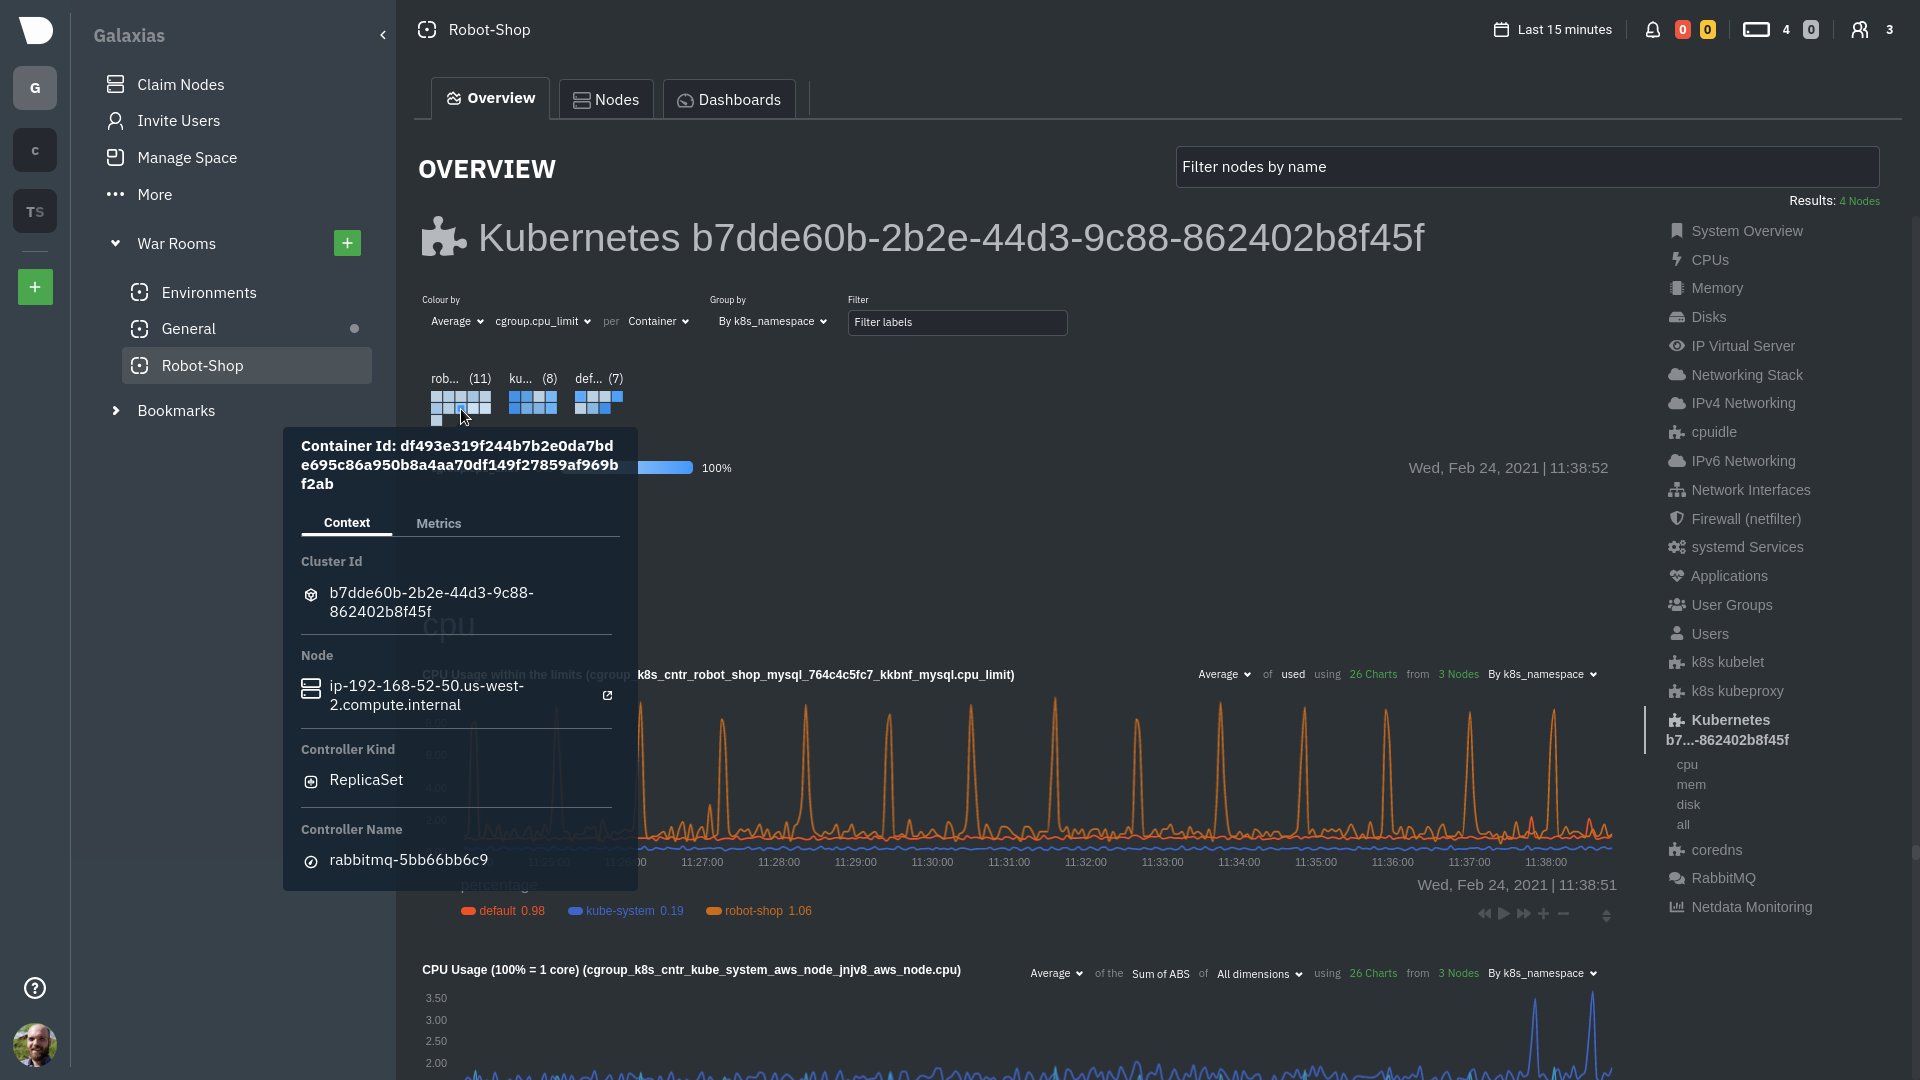 |
| 137 | |
| 138 | The **Context** tab shows `rabbitmq-5bb66bb6c9-6xr5b` as the container's image name, which means this container is |
| 139 | running a [RabbitMQ](/src/go/plugin/go.d/collector/rabbitmq/README.md) workload. |
| 140 | |
| 141 | Click the **Metrics** tab to see real-time metrics from that container. Unsurprisingly, it shows a spike in CPU |
| 142 | utilization at regular intervals. |
| 143 | |
| 144 | 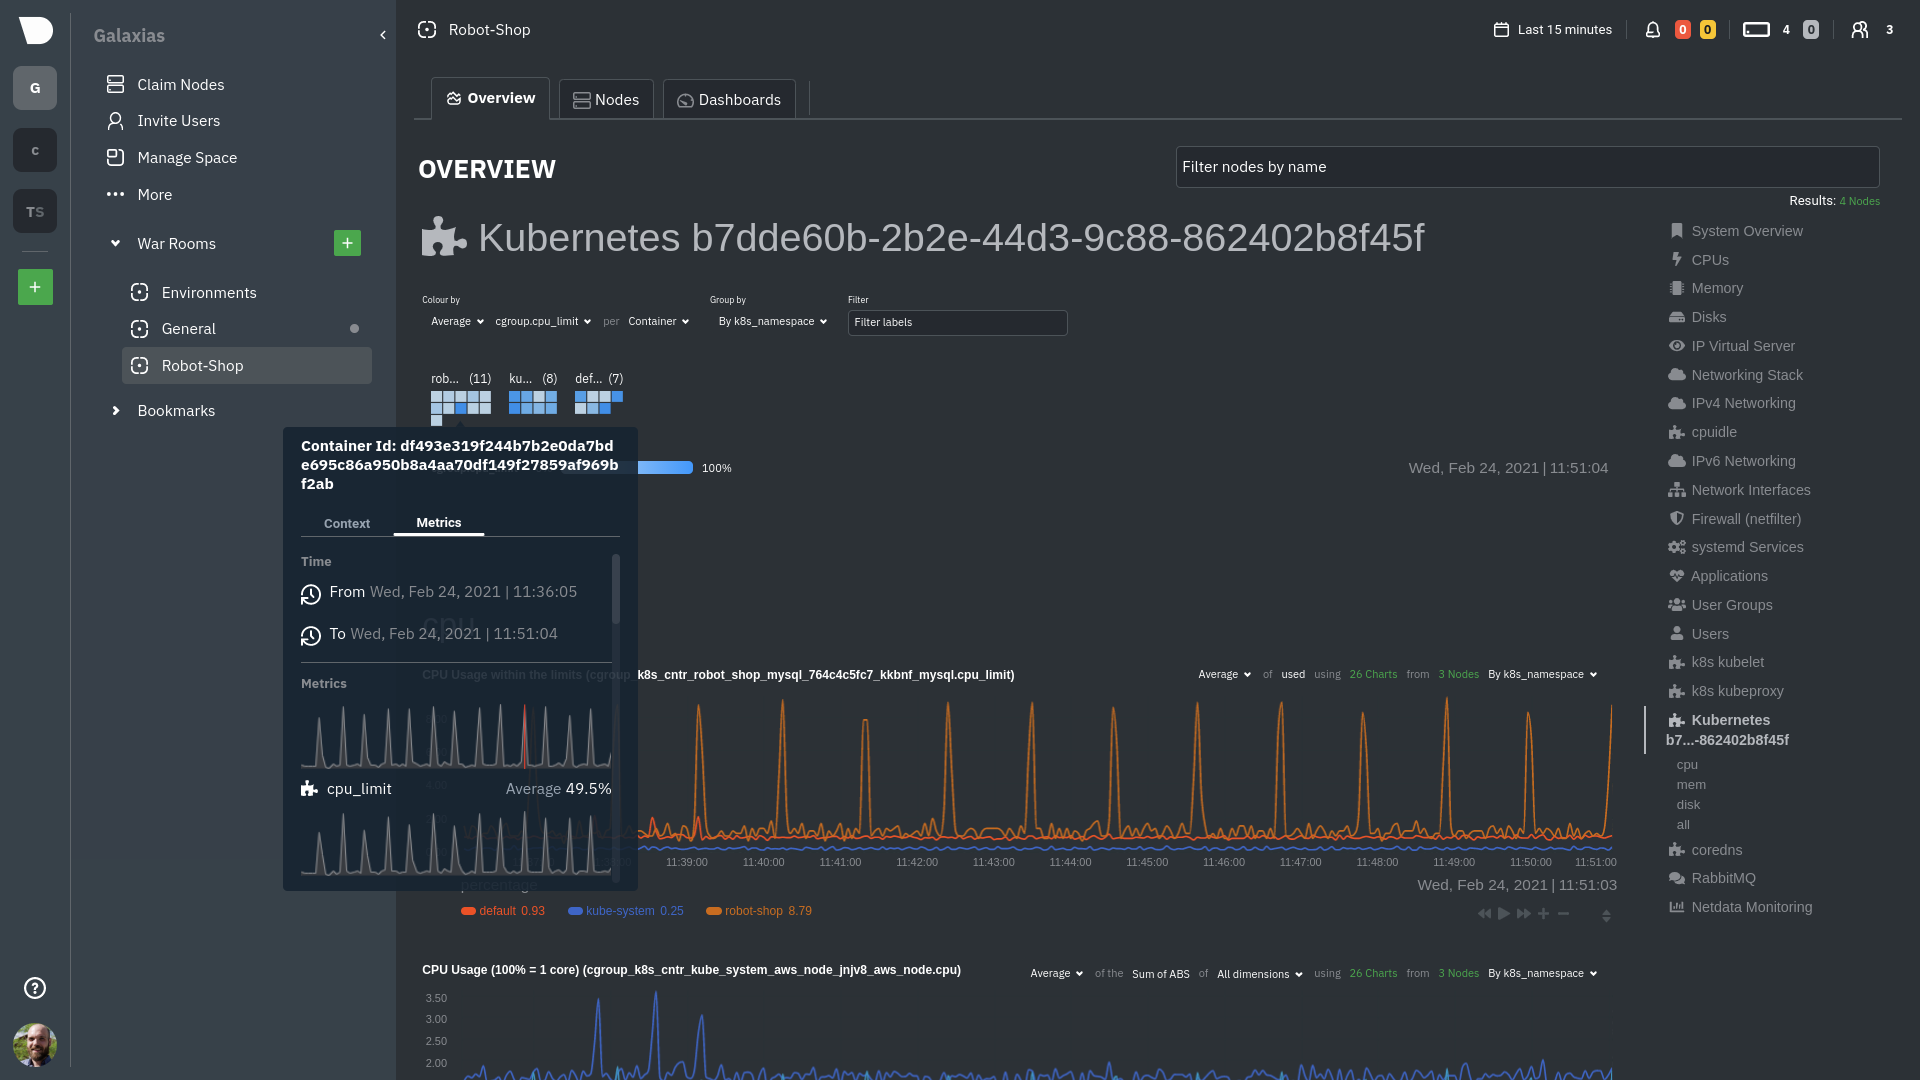 |
| 146 | |
| 147 | ### Time-series charts |
| 148 | |
| 149 | Beneath the health map is a variety of time-series charts that help you visualize resource utilization over time, which |
| 150 | is useful for targeted troubleshooting. |
| 151 | |
| 152 | The default is to display metrics grouped by the `k8s_namespace` label, which shows resource utilization based on your |
| 153 | different namespaces. |
| 154 | |
| 155 | 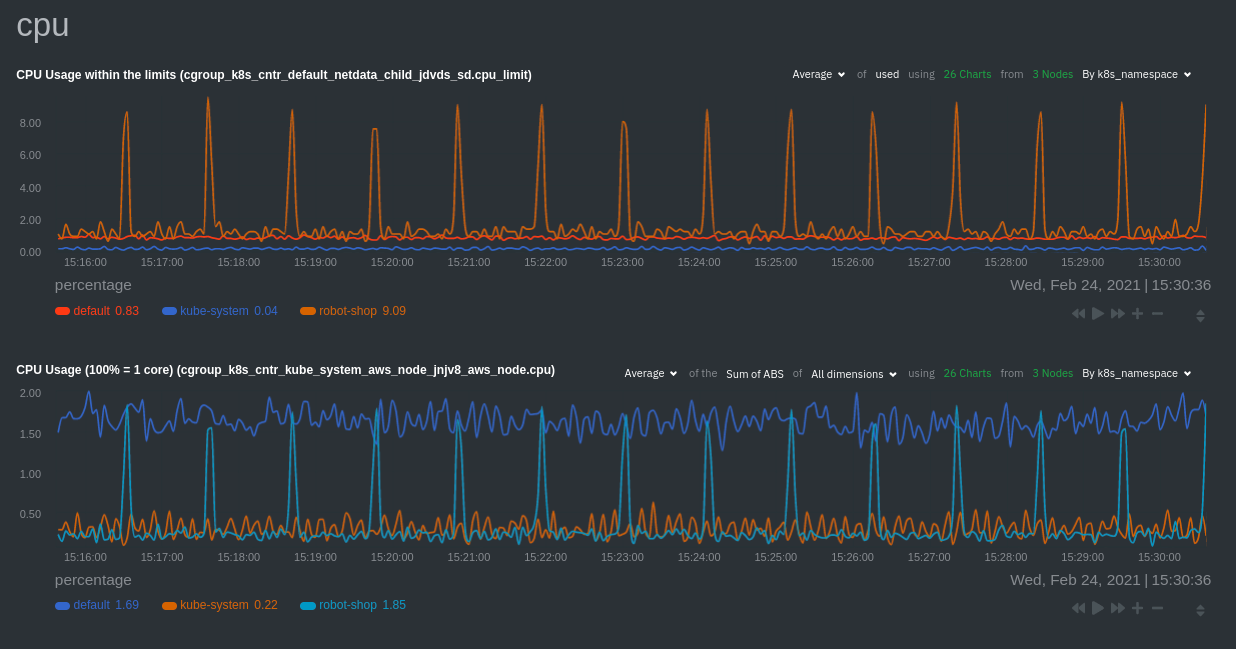 |
| 157 | |
| 158 | Each composite chart has a [definition bar](/docs/dashboards-and-charts/netdata-charts.md#definition-bar) |
| 159 | for complete customization. For example, grouping the top chart by `k8s_container_name` reveals new information. |
| 160 | |
| 161 | 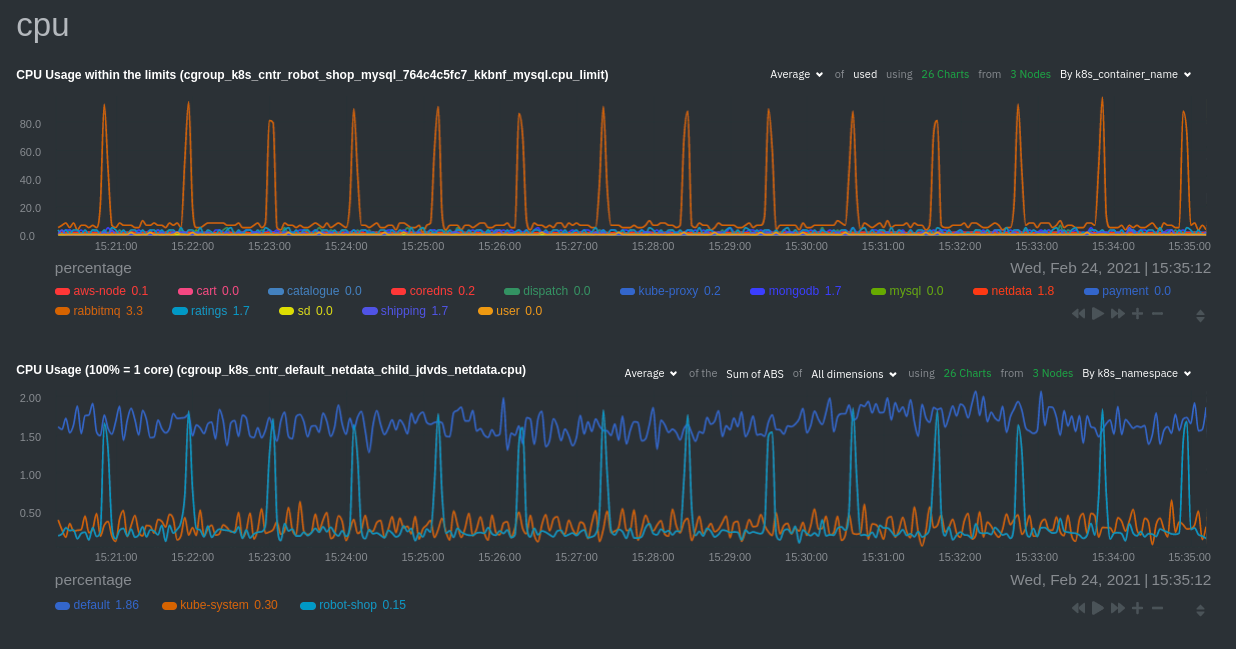 |
| 162 | |
| 163 | ## Service metrics |
| 164 | |
| 165 | Netdata has a [service discovery plugin](https://github.com/netdata/agent-service-discovery), which discovers and |
| 166 | creates configuration files for [compatible |
| 167 | services](https://github.com/netdata/helmchart#service-discovery-and-supported-services) and any endpoints covered by |
| 168 | our [generic Prometheus collector](/src/go/plugin/go.d/collector/prometheus/README.md). |
| 169 | Netdata uses these files to collect metrics from any compatible application as they run _inside_ of a pod. Service |
| 170 | discovery happens without manual intervention as pods are created, destroyed, or moved between nodes. |
| 171 | |
| 172 | Service metrics show up on the Overview as well, beneath the **Kubernetes** section, and are labeled according to the |
| 173 | service in question. For example, the **RabbitMQ** section has numerous charts from the [`rabbitmq` |
| 174 | collector](/src/go/plugin/go.d/collector/rabbitmq/README.md): |
| 175 | |
| 176 | 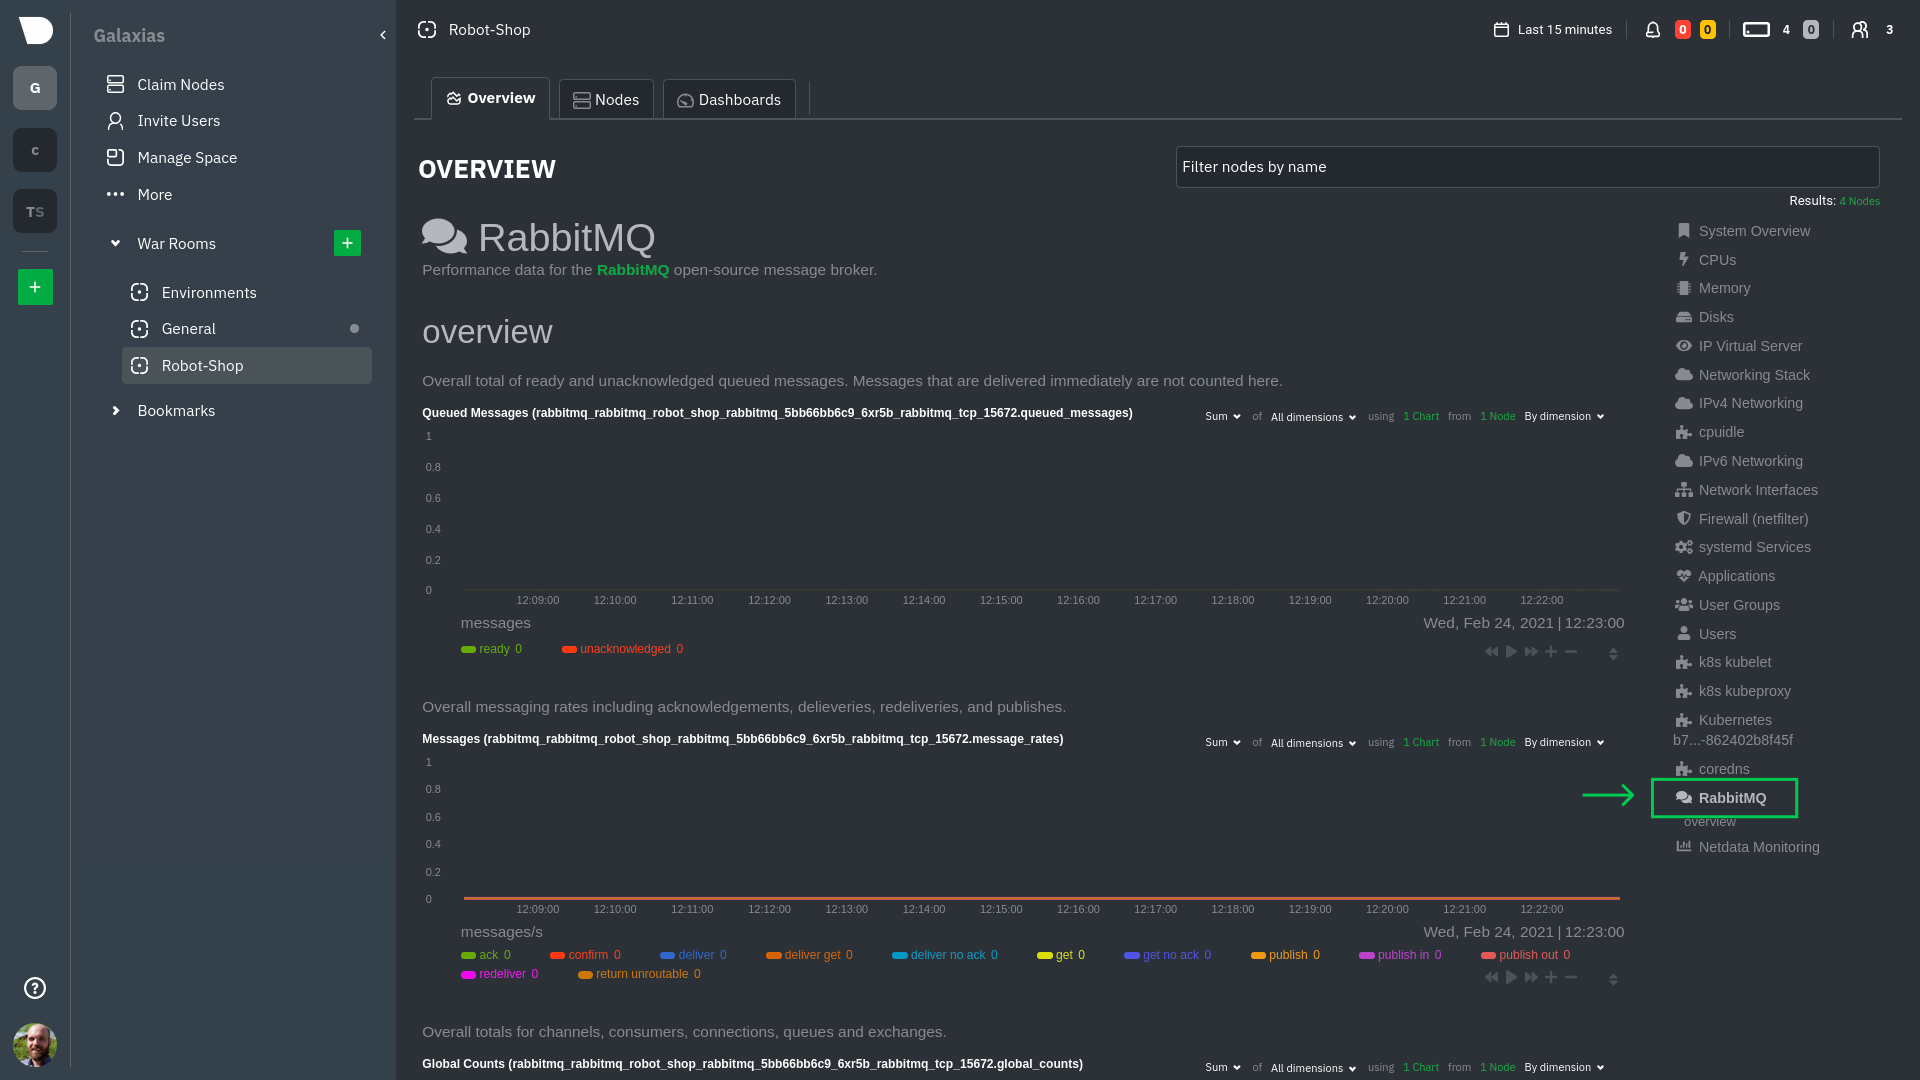 |
| 178 | |
| 179 | > The robot-shop cluster has more supported services, such as MySQL, which are not visible with zero configuration. This |
| 180 | > is usually because of services running on non-default ports, using non-default names, or required passwords. Read up |
| 181 | > on [configuring service discovery](/packaging/installer/methods/kubernetes.md#configure-service-discovery) to collect |
| 182 | > more service metrics. |
| 183 | |
| 184 | Service metrics are essential to infrastructure monitoring, as they're the best indicator of the end-user experience, |
| 185 | and key signals for troubleshooting anomalies or issues. |
| 186 | |
| 187 | ## Kubernetes components |
| 188 | |
| 189 | Netdata also automatically collects metrics from two essential Kubernetes processes. |
| 190 | |
| 191 | ### kubelet |
| 192 | |
| 193 | The **k8s kubelet** section visualizes metrics from the Kubernetes agent responsible for managing every pod on a given |
| 194 | node. This also happens without any configuration thanks to the [kubelet |
| 195 | collector](/src/go/plugin/go.d/collector/k8s_kubelet/README.md). |
| 196 | |
| 197 | Monitoring each node's kubelet can be invaluable when diagnosing issues with your Kubernetes cluster. For example, you |
| 198 | can see if the number of running containers/pods has dropped, which could signal a fault or crash in a particular |
| 199 | Kubernetes service or deployment (see `kubectl get services` or `kubectl get deployments` for more details). If the |
| 200 | number of pods increases, it may be because of something more benign, like another team member scaling up a |
| 201 | service with `kubectl scale`. |
| 202 | |
| 203 | You can also view charts for the Kubelet API server, the volume of runtime/Docker operations by type, |
| 204 | configuration-related errors, and the actual vs. desired numbers of volumes, plus a lot more. |
| 205 | |
| 206 | ### kube-proxy |
| 207 | |
| 208 | The **k8s kube-proxy** section displays metrics about the network proxy that runs on each node in your Kubernetes |
| 209 | cluster. kube-proxy lets pods communicate with each other and accept sessions from outside your cluster. Its metrics are |
| 210 | collected by the [kube-proxy |
| 211 | collector](/src/go/plugin/go.d/collector/k8s_kubeproxy/README.md). |
| 212 | |
| 213 | With Netdata, you can monitor how often your k8s proxies are syncing proxy rules between nodes. Dramatic changes in |
| 214 | these figures could indicate an anomaly in your cluster that's worthy of further investigation. |
| 215 | |
| 216 | ## What's next? |
| 217 | |
| 218 | After reading this guide, you should now be able to monitor any Kubernetes cluster with Netdata, including nodes, pods, |
| 219 | containers, services, and more. |
| 220 | |
| 221 | With the health map, time-series charts, and the ability to drill down into individual nodes, you can see hundreds of |
| 222 | per-second metrics with zero configuration and less time remembering all the `kubectl` options. Netdata moves with your |
| 223 | cluster, automatically picking up new nodes or services as your infrastructure scales. And it's entirely free for |
| 224 | clusters of all sizes. |
| 225 | |
| 226 | ### Related reference documentation |
| 227 | |
| 228 | - [Netdata Helm chart](https://github.com/netdata/helmchart) |
| 229 | - [Netdata service discovery](https://github.com/netdata/agent-service-discovery) |
| 230 | - [Netdata Agent · `kubelet` |
| 231 | collector](/src/go/plugin/go.d/collector/k8s_kubelet/README.md) |
| 232 | - [Netdata Agent · `kube-proxy` |
| 233 | collector](/src/go/plugin/go.d/collector/k8s_kubeproxy/README.md) |
| 234 | - [Netdata Agent · `cgroups.plugin`](/src/collectors/cgroups.plugin/README.md) |