| 1 | <!-- |
| 2 | title: "Monitor Pi-hole (and a Raspberry Pi) with Netdata" |
| 3 | sidebar_label: "Monitor Pi-hole (and a Raspberry Pi) with Netdata" |
| 4 | description: "Monitor Pi-hole metrics, plus Raspberry Pi system metrics, in minutes and completely for free with Netdata's open-source monitoring agent." |
| 5 | image: /img/seo/guides/monitor/netdata-pi-hole-raspberry-pi.png |
| 6 | custom_edit_url: https://github.com/netdata/netdata/edit/master/docs/guides/monitor/pi-hole-raspberry-pi.md |
| 7 | learn_status: "Published" |
| 8 | learn_rel_path: "Miscellaneous" |
| 9 | --> |
| 10 | |
| 11 | # Monitor Pi-hole (and a Raspberry Pi) with Netdata |
| 12 | |
| 13 | import { OneLineInstallWget } from '@site/src/components/OneLineInstall/' |
| 14 | |
| 15 | Between intrusive ads, invasive trackers, and vicious malware, many techies and homelab enthusiasts are advancing their |
| 16 | networks' security and speed with a tiny computer and a powerful piece of software: [Pi-hole](https://pi-hole.net/). |
| 17 | |
| 18 | Pi-hole is a DNS sinkhole that prevents unwanted content from even reaching devices on your home network. It blocks ads |
| 19 | and malware at the network, instead of using extensions/add-ons for individual browsers, so you'll stop seeing ads in |
| 20 | some of the most intrusive places, like your smart TV. Pi-hole can even [improve your network's speed and reduce |
| 21 | bandwidth](https://discourse.pi-hole.net/t/will-pi-hole-slow-down-my-network/2048). |
| 22 | |
| 23 | Most Pi-hole users run it on a [Raspberry Pi](https://www.raspberrypi.org/products/raspberry-pi-4-model-b/) (hence the |
| 24 | name), a credit card-sized, super-capable computer that costs about $35. |
| 25 | |
| 26 | And to keep tabs on how both Pi-hole and the Raspberry Pi are working to protect your network, you can use the |
| 27 | open-source [Netdata monitoring agent](https://github.com/netdata/netdata). |
| 28 | |
| 29 | To get started, all you need is a [Raspberry Pi](https://www.raspberrypi.org/products/raspberry-pi-4-model-b/) with |
| 30 | Raspbian installed. This guide uses a Raspberry Pi 4 Model B and Raspbian GNU/Linux 10 (buster). This guide assumes |
| 31 | you're connecting to a Raspberry Pi remotely over SSH, but you could also complete all these steps on the system |
| 32 | directly using a keyboard, mouse, and monitor. |
| 33 | |
| 34 | ## Why monitor Pi-hole and a Raspberry Pi with Netdata? |
| 35 | |
| 36 | Netdata helps you monitor and troubleshoot all kinds of devices and the applications they run, including IoT devices |
| 37 | like the Raspberry Pi and applications like Pi-hole. |
| 38 | |
| 39 | After a two-minute installation and with zero configuration, you'll be able to see all of Pi-hole's metrics, including |
| 40 | the volume of queries, connected clients, DNS queries per type, top clients, top blocked domains, and more. |
| 41 | |
| 42 | With Netdata installed, you can also monitor system metrics and any other applications you might be running. By default, |
| 43 | Netdata collects metrics on CPU usage, disk IO, bandwidth, per-application resource usage, and a ton more. With the |
| 44 | Raspberry Pi used for this guide, Netdata automatically collects about 1,500 metrics every second! |
| 45 | |
| 46 | 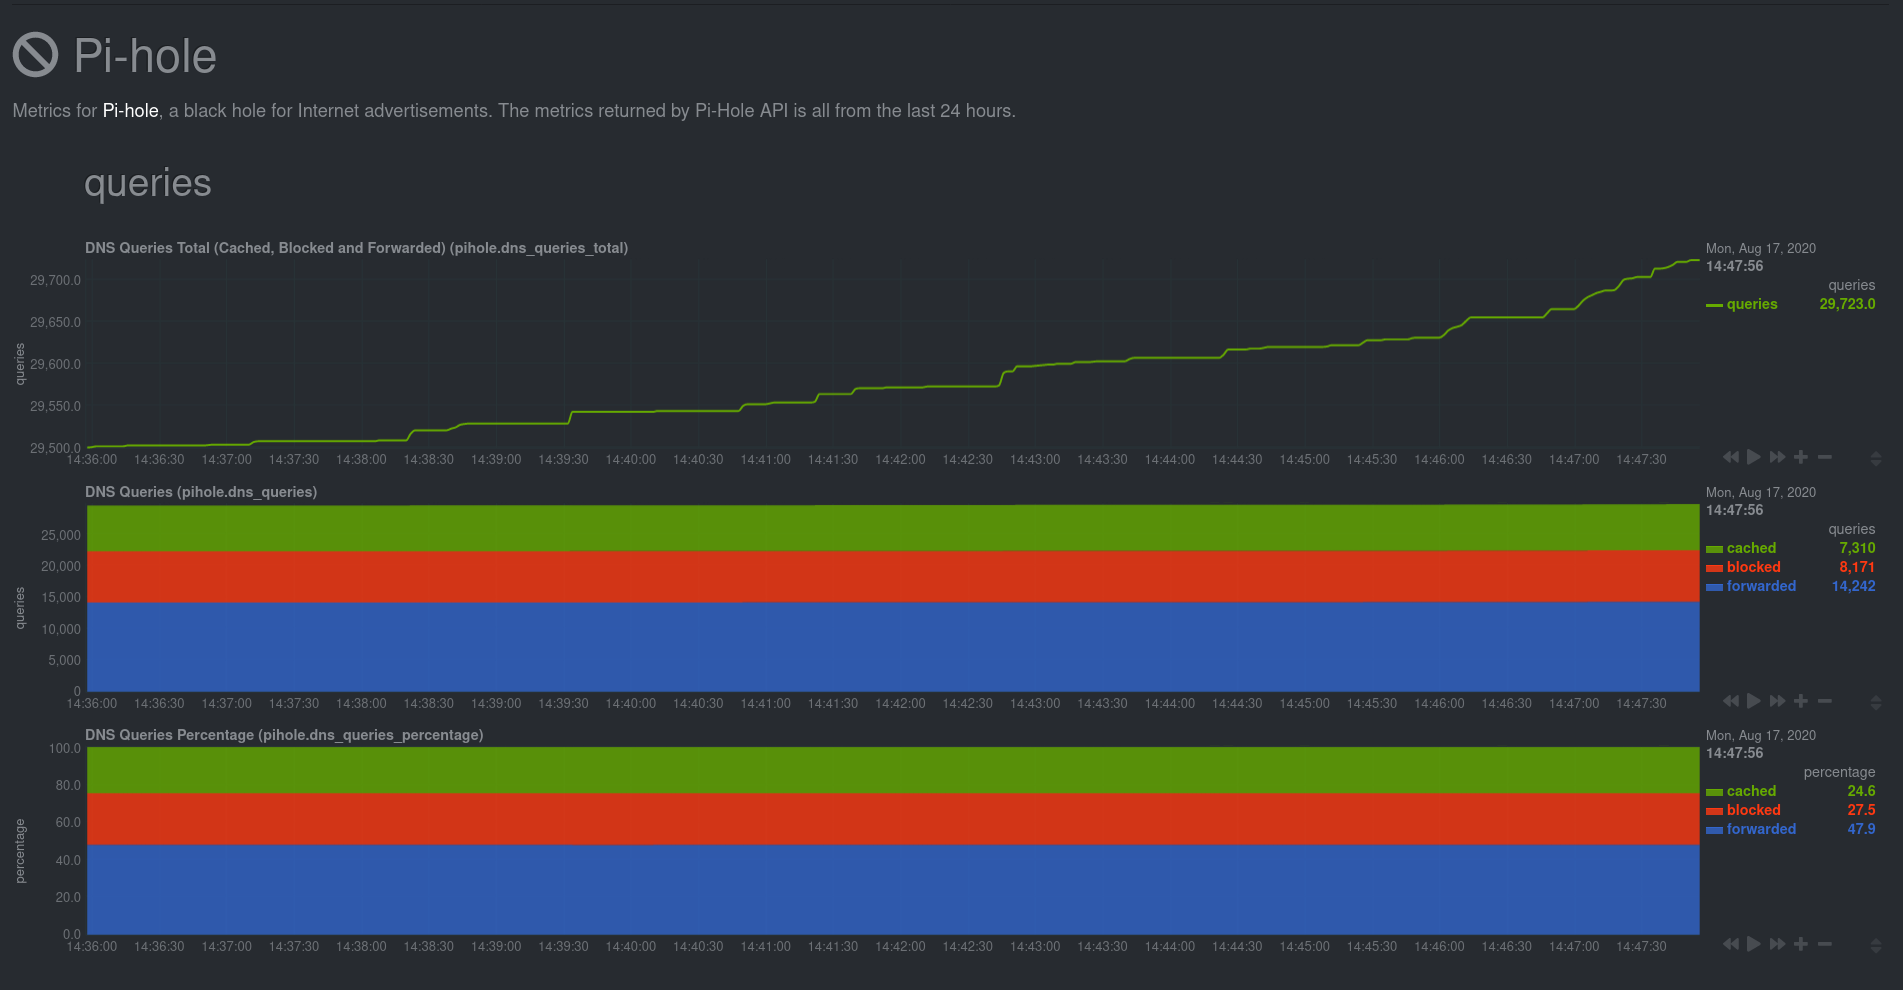 |
| 48 | |
| 49 | ## Install Netdata |
| 50 | |
| 51 | Let's start by installing Netdata first so that it can start collecting system metrics as soon as possible for the most |
| 52 | possible historic data. |
| 53 | |
| 54 | > ⚠️ Don't install Netdata using `apt` and the default package available in Raspbian. The Netdata team does not maintain |
| 55 | > this package, and can't guarantee it works properly. |
| 56 | |
| 57 | On Raspberry Pis running Raspbian, the best way to install Netdata is our one-line kickstart script. This script asks |
| 58 | you to install dependencies, then compiles Netdata from source via [GitHub](https://github.com/netdata/netdata). |
| 59 | |
| 60 | <OneLineInstallWget/> |
| 61 | |
| 62 | Once installed on a Raspberry Pi 4 with no accessories, Netdata starts collecting roughly 1,500 metrics every second and |
| 63 | populates its dashboard with more than 250 charts. |
| 64 | |
| 65 | Open your browser of choice and navigate to `http://NODE:19999/`, replacing `NODE` with the IP address of your Raspberry |
| 66 | Pi. Not sure what that IP is? Try running `hostname -I | awk '{print $1}'` from the Pi itself. |
| 67 | |
| 68 | You'll see Netdata's dashboard and a few hundred real-time, interactive charts. Feel free to explore, but let's turn our attention to installing Pi-hole. |
| 69 | |
| 70 | ## Install Pi-Hole |
| 71 | |
| 72 | Like Netdata, Pi-hole has a one-line script for simple installation. From your Raspberry Pi, run the following: |
| 73 | |
| 74 | ```bash |
| 75 | curl -sSL https://install.pi-hole.net | bash |
| 76 | ``` |
| 77 | |
| 78 | The installer will help you set up Pi-hole based on the topology of your network. Once finished, you should set up your |
| 79 | devices—or your router for system-wide sinkhole protection—to [use Pi-hole as their DNS |
| 80 | service](https://discourse.pi-hole.net/t/how-do-i-configure-my-devices-to-use-pi-hole-as-their-dns-server/245). You've |
| 81 | finished setting up Pi-hole at this point. |
| 82 | |
| 83 | As far as configuring Netdata to monitor Pi-hole metrics, there's nothing you actually need to do. Netdata's [Pi-hole |
| 84 | collector](/src/go/plugin/go.d/collector/pihole/README.md) will autodetect the new service |
| 85 | running on your Raspberry Pi and immediately start collecting metrics every second. |
| 86 | |
| 87 | Restart Netdata with `sudo systemctl restart netdata`, which will then recognize that Pi-hole is running and start a |
| 88 | per-second collection job. When you refresh your Netdata dashboard or load it up again in a new tab, you'll see a new |
| 89 | entry in the menu for **Pi-hole** metrics. |
| 90 | |
| 91 | ## Use Netdata to explore and monitor your Raspberry Pi and Pi-hole |
| 92 | |
| 93 | By the time you've reached this point in the guide, Netdata has already collected a ton of valuable data about your |
| 94 | Raspberry Pi, Pi-hole, and any other apps/services you might be running. Even a few minutes of collecting 1,500 metrics |
| 95 | per second adds up quickly. |
| 96 | |
| 97 | You can now use Netdata's synchronized charts to zoom, highlight, scrub through time, and discern how an anomaly in one |
| 98 | part of your system might affect another. |
| 99 | |
| 100 | 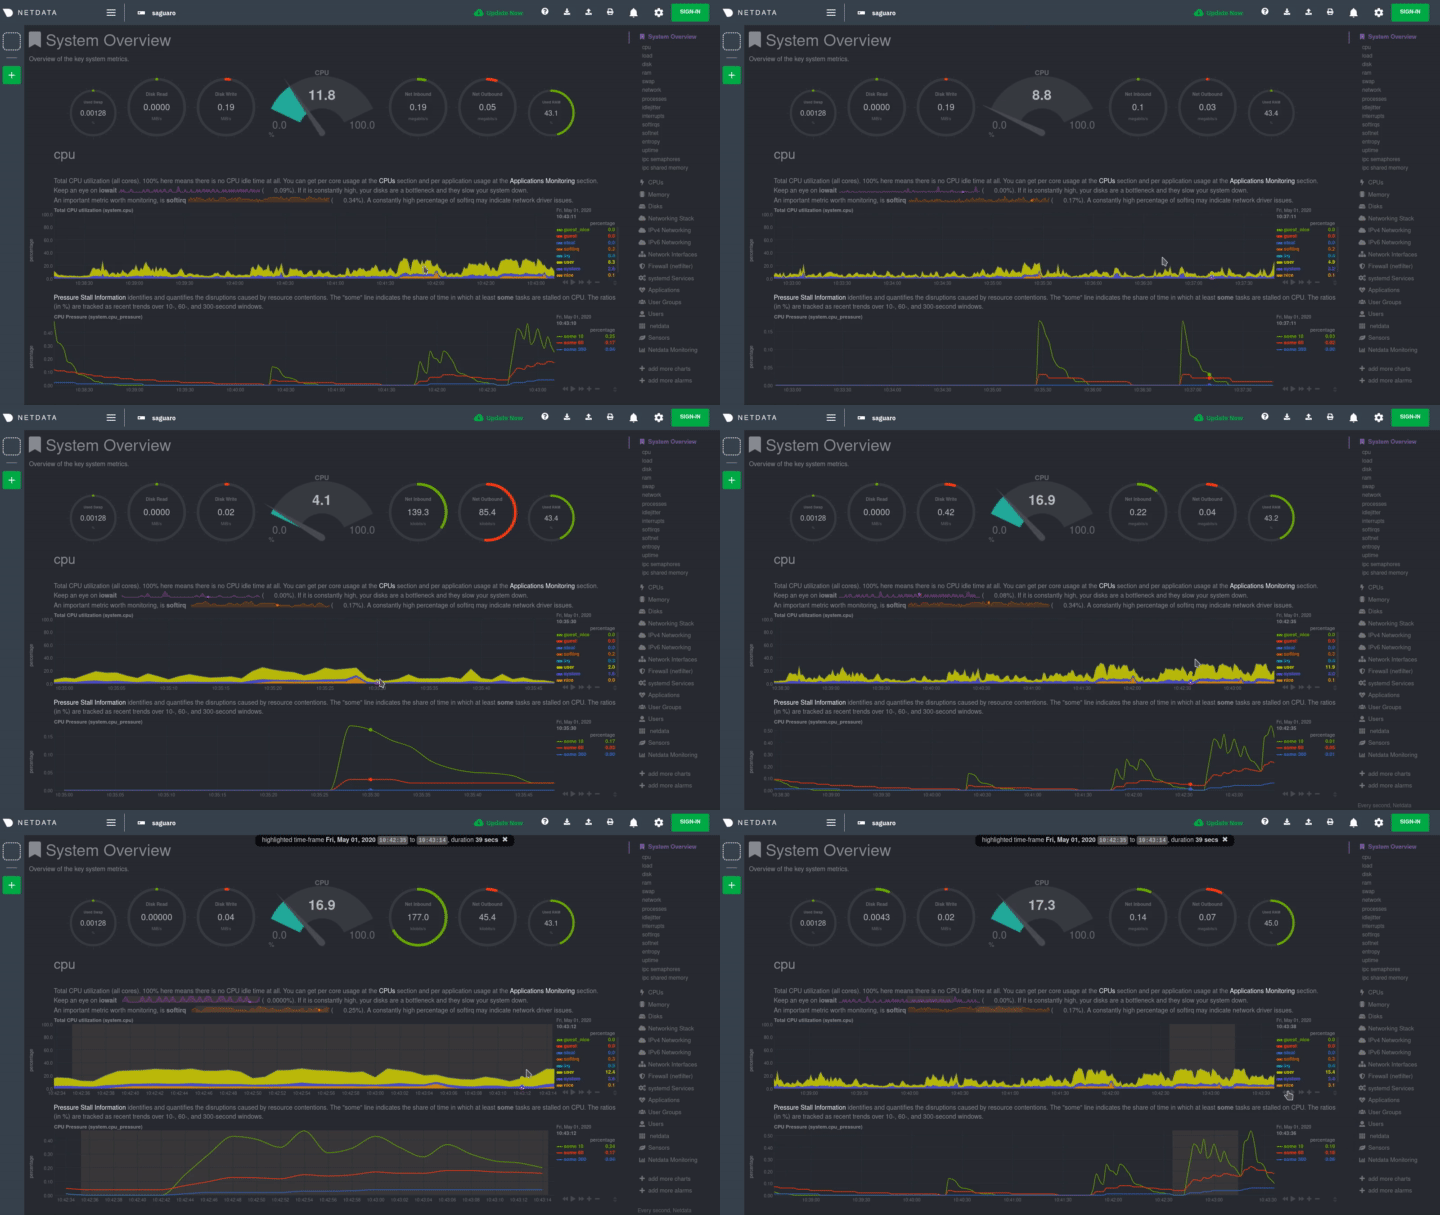 |
| 102 | |
| 103 | ### Storing historical metrics on your Raspberry Pi |
| 104 | |
| 105 | By default, Netdata allocates 256 MiB in disk space to store historical metrics inside the [database |
| 106 | engine](/src/database/engine/README.md). On the Raspberry Pi used for this guide, Netdata collects 1,500 metrics every |
| 107 | second, which equates to storing 3.5 days worth of historical metrics. |
| 108 | |
| 109 | You can increase this allocation by editing `netdata.conf` and increasing the `dbengine multihost disk space` setting to |
| 110 | more than 256. |
| 111 | |
| 112 | ```yaml |
| 113 | [global] |
| 114 | dbengine multihost disk space = 512 |
| 115 | ``` |
| 116 | |
| 117 | Use our [database sizing |
| 118 | calculator](/docs/netdata-agent/configuration/optimizing-metrics-database/change-metrics-storage.md#calculate-the-system-resources-ram-disk-space-needed-to-store-metrics) |
| 119 | and the [Database configuration documentation](/src/database/README.md) to help you determine the right |
| 120 | setting for your Raspberry Pi. |