| 1 | # Anomaly detection for RPi monitoring |
| 2 | |
| 3 | Learn how to use a low-overhead machine learning algorithm alongside Netdata to detect anomalous metrics on a Raspberry Pi. |
| 4 | |
| 5 | We love IoT and edge at Netdata, we also love machine learning. Even better if we can combine the two to ease the pain |
| 6 | of monitoring increasingly complex systems. |
| 7 | |
| 8 | We recently explored what might be involved in enabling our Python-based [anomalies |
| 9 | collector](/src/collectors/python.d.plugin/anomalies/README.md) on a Raspberry Pi. To our delight, it's actually quite |
| 10 | straightforward! |
| 11 | |
| 12 | Read on to learn all the steps and enable unsupervised anomaly detection on your on Raspberry Pi(s). |
| 13 | |
| 14 | > Spoiler: It's just a couple of extra commands that will make you feel like a pro. |
| 15 | |
| 16 | ## What you need to get started |
| 17 | |
| 18 | - A Raspberry Pi running Raspbian, which we'll call a _node_. |
| 19 | - The [open-source Netdata](https://github.com/netdata/netdata) monitoring agent. If you don't have it installed on your |
| 20 | node yet, [get started now](/packaging/installer/README.md). |
| 21 | |
| 22 | ## Install dependencies |
| 23 | |
| 24 | First make sure Netdata is using Python 3 when it runs Python-based data collectors. |
| 25 | |
| 26 | Next, open `netdata.conf` using [`edit-config`](/docs/netdata-agent/configuration/README.md#edit-configuration-files) |
| 27 | from within the [Netdata config directory](/docs/netdata-agent/configuration/README.md#locate-your-config-directory). Scroll down to the |
| 28 | `[plugin:python.d]` section to pass in the `-ppython3` command option. |
| 29 | |
| 30 | ```text |
| 31 | [plugin:python.d] |
| 32 | # update every = 1 |
| 33 | command options = -ppython3 |
| 34 | ``` |
| 35 | |
| 36 | Next, install some of the underlying libraries used by the Python packages the collector depends upon. |
| 37 | |
| 38 | ```bash |
| 39 | sudo apt install llvm-9 libatlas3-base libgfortran5 libatlas-base-dev |
| 40 | ``` |
| 41 | |
| 42 | Now you're ready to install the Python packages used by the collector itself. First, become the `netdata` user. |
| 43 | |
| 44 | ```bash |
| 45 | sudo su -s /bin/bash netdata |
| 46 | ``` |
| 47 | |
| 48 | Then pass in the location to find `llvm` as an environment variable for `pip3`. |
| 49 | |
| 50 | ```bash |
| 51 | LLVM_CONFIG=llvm-config-9 pip3 install --user llvmlite numpy==1.20.1 netdata-pandas==0.0.38 numba==0.50.1 scikit-learn==0.23.2 pyod==0.8.3 |
| 52 | ``` |
| 53 | |
| 54 | ## Enable the anomalies collector |
| 55 | |
| 56 | Now you're ready to enable the collector and restart Netdata. |
| 57 | |
| 58 | ```bash |
| 59 | sudo ./edit-config python.d.conf |
| 60 | |
| 61 | # restart netdata |
| 62 | sudo systemctl restart netdata |
| 63 | ``` |
| 64 | |
| 65 | And that should be it! Wait a minute or two, refresh your Netdata dashboard, you should see the default anomalies |
| 66 | charts under the **Anomalies** section in the dashboard's menu. |
| 67 | |
| 68 | 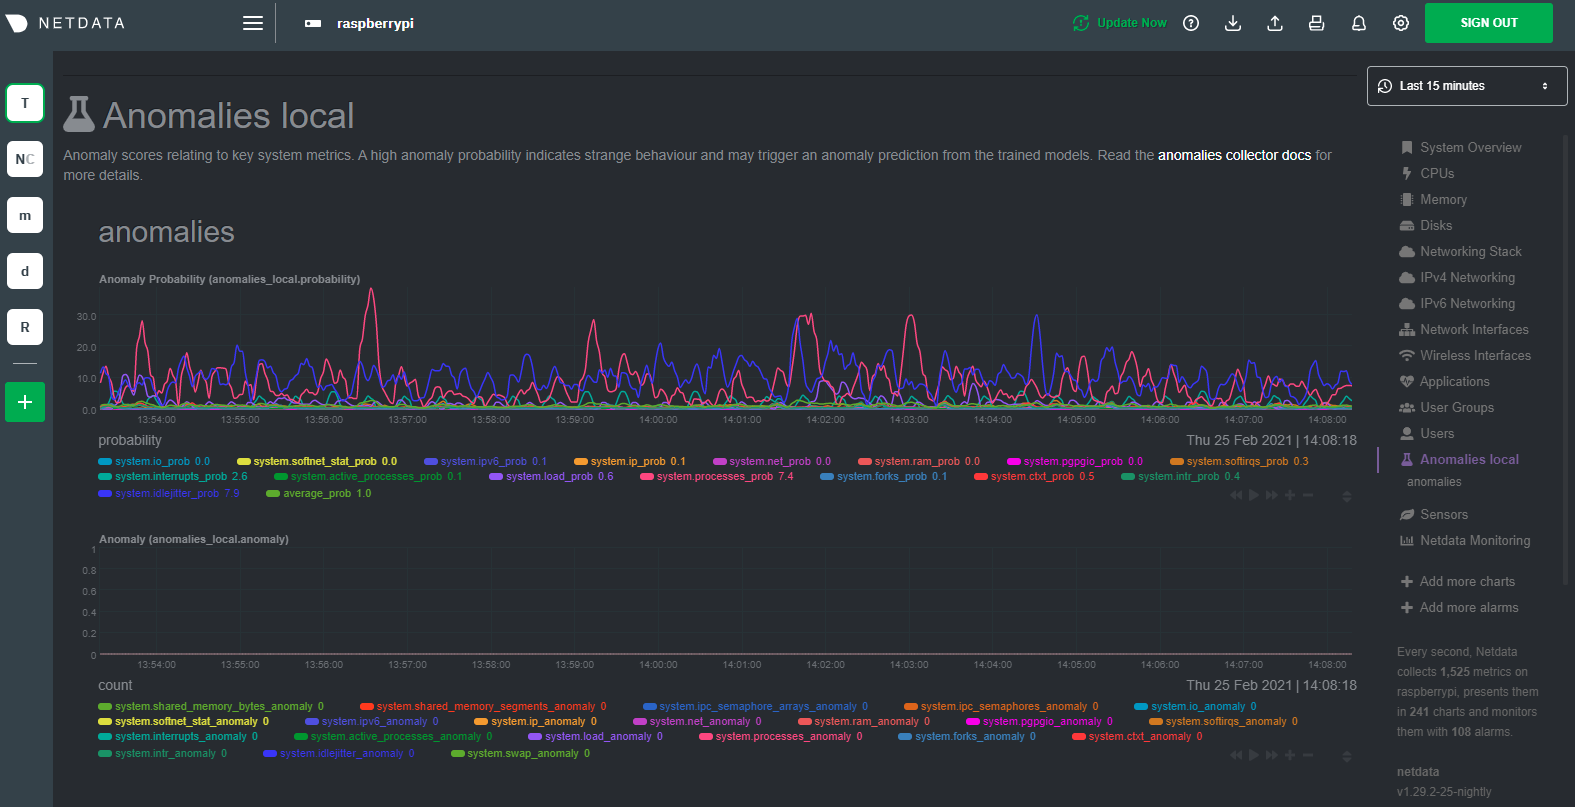 |
| 70 | |
| 71 | ## Overhead on system |
| 72 | |
| 73 | Of course one of the most important considerations when trying to do anomaly detection at the edge (as opposed to in a |
| 74 | centralized cloud somewhere) is the resource utilization impact of running a monitoring tool. |
| 75 | |
| 76 | With the default configuration, the anomalies collector uses about 6.5% of CPU at each run. During the retraining step, |
| 77 | CPU utilization jumps to between 20-30% for a few seconds, but you can [configure |
| 78 | retraining](/src/collectors/python.d.plugin/anomalies/README.md#configuration) to happen less often if you wish. |
| 79 | |
| 80 | 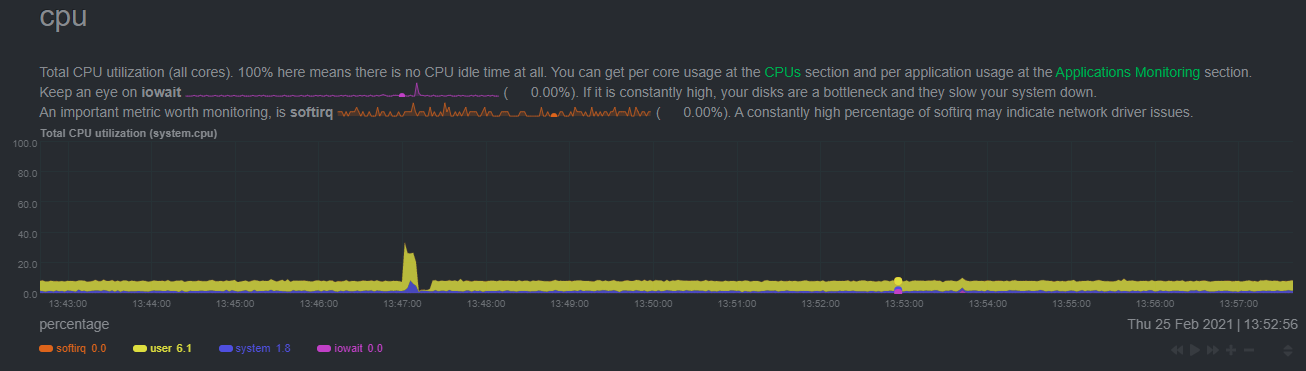 |
| 82 | |
| 83 | In terms of the runtime of the collector, it was averaging around 250ms during each prediction step, jumping to about |
| 84 | 8-10 seconds during a retraining step. This jump equates only to a small gap in the anomaly charts for a few seconds. |
| 85 | |
| 86 | 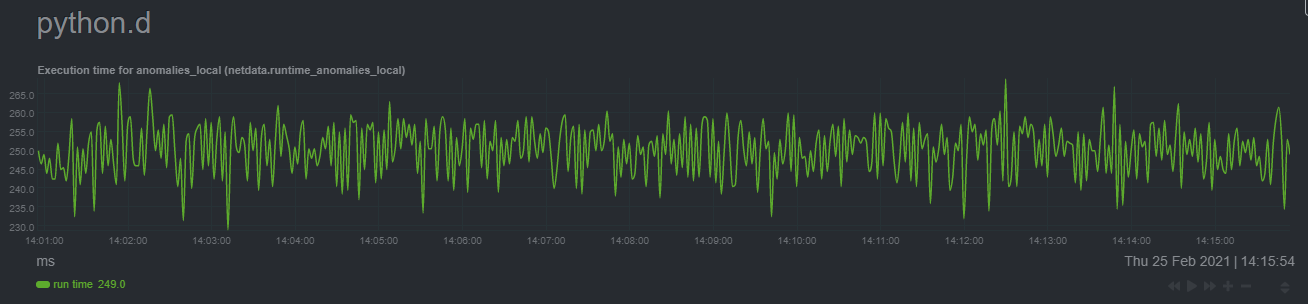 |
| 88 | |
| 89 | The last consideration then is the amount of RAM the collector needs to store both the models and some of the data |
| 90 | during training. By default, the anomalies collector, along with all other running Python-based collectors, uses about |
| 91 | 100MB of system memory. |
| 92 | |
| 93 | 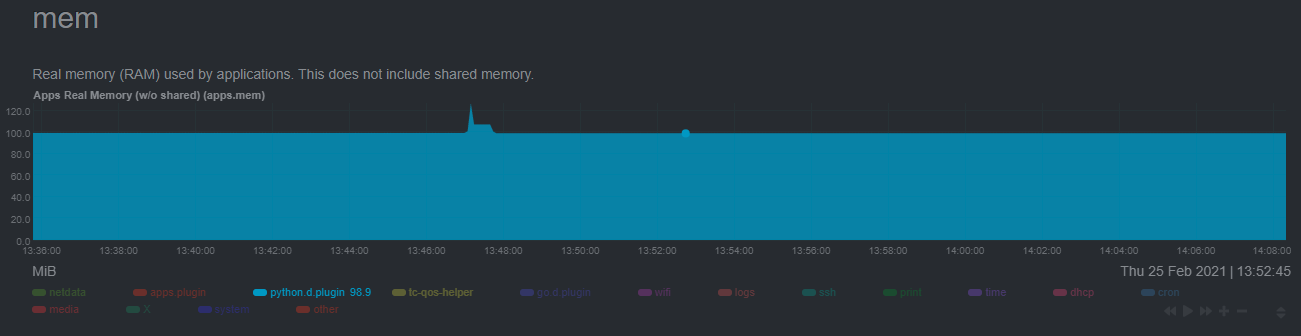 |
| 95 | |
| 96 |